When running other people’s software, there are a variety of ways that one can impact the deployment. Developers typically provide a set of configurations that can be set during deployment. Additional configurations are available once it’s running. These are design choices to decide which levers to provide and how flexible to make them. I wanted my instance to do some stuff that the latest release doesn’t do.
There are a ton of new features showing up in the GitHub mastodon/mastodon repo. One such feature is Open Telemetry auto-instrumentation, added without any specific vendor tie-ins. This doesn’t expose the user’s data to a Google Analytics type of operation. It does track the durations for tons if internal operations and send them, as traces, to the destination of your choosing.
What do I already have?
The services are running, exposed to the internet. Stuff happens when people access them. I have logs.
- Nginx ingress access logs
- Mastodon logs
- Web logs
- Sidekiq logs
- Stream service logs
- Pod logs from postgres and redis
- Kubernetes logs
- Container runtime logs
- Scheduler logs
- Node logs
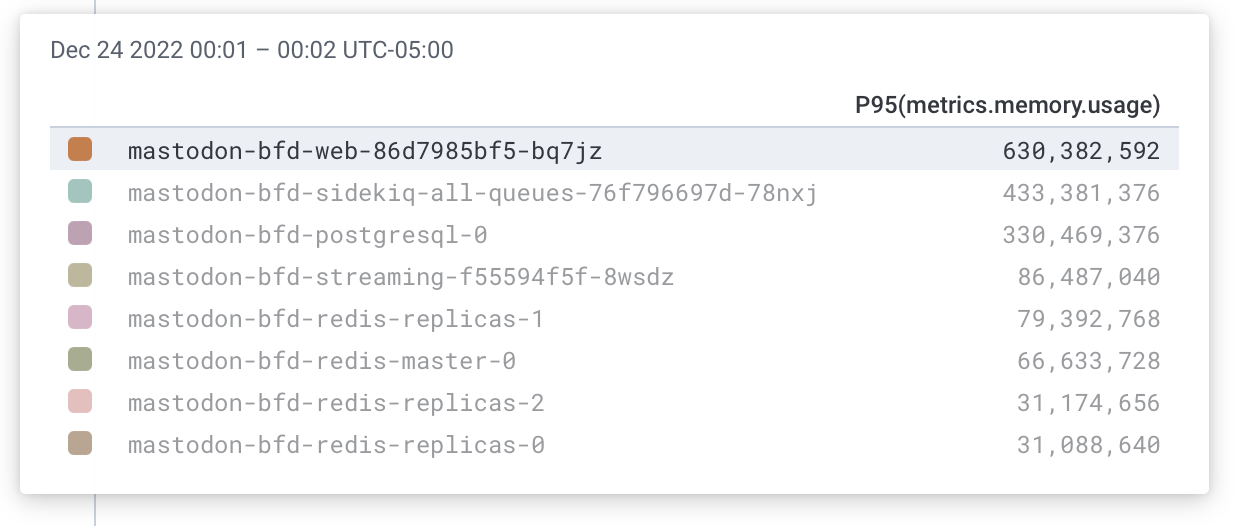
I have metrics.
- Kubernetes Agent
- Node
- Pod
- Container
- Volume
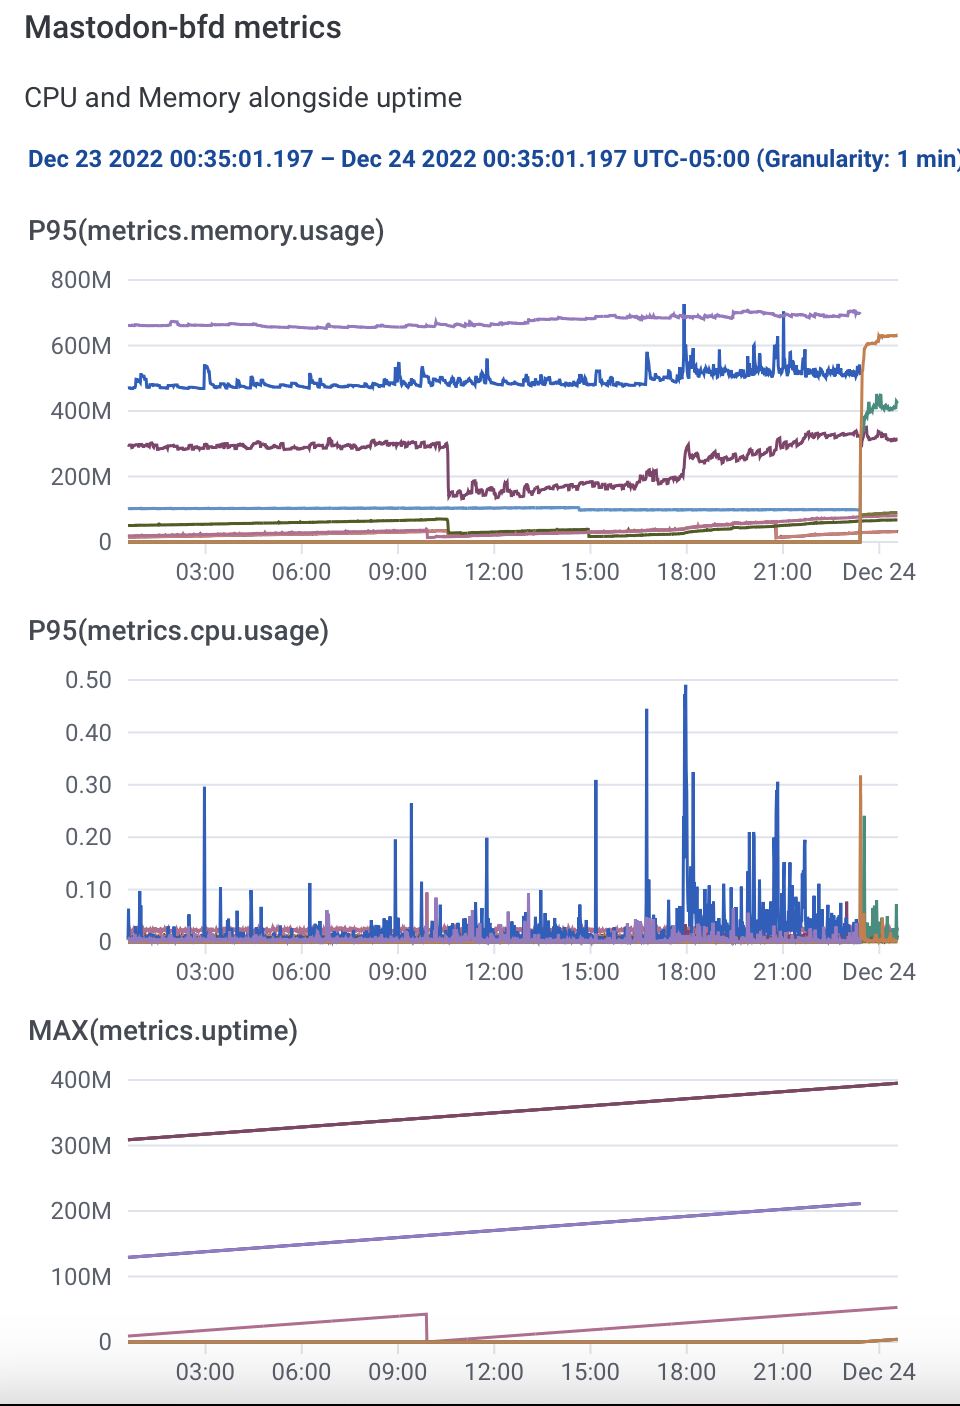
So I can alert on things showing up in logs or things showing up in the agent.
This nicely handles things like disk space or CPU exhaustion.
This does not nicely handle things like intra-service latency issues.
What I want
I want to know if something goes viral or entirely offline. Fathom Analytics handles those. (Kinda)
I want to know if intra-service dependencies are slowing things down. Open Telemetry handles that. (Kinda)
The right way
Since it’s an open source project, the right thing to do is create a fork, add the features, make them configurable, and submit a pull request. Then begin a lobbying campaign to help justify the dev team spending time to merge it into the shared codebase.
Since there’s a month-old open telemetry PR sitting out there now, I don’t think the lobbying approach is right for today.
Let the shenanigans begin
The mechanism I choose to hanle this is “stupid patch scripts” which will just edit files or replace them and then build a new image.
There are also some tweaks to the helm chart to add the OTEL configurations since those are less janky.
Here’s the repo which has only the weird parts.
The mechanics of the repo are as follows:
- It has a pipeline definition that runs a single build job
- The build job clones the mastodon/mastodon repo from github, patches it two ways, and then builds the image
- At the end of that job, there’s a container tagged with the commit short sha
- Some “latest” and “tag” release jobs are available if it all works out and I want to make these the newest ones
What are these two patches?
First is git shenanigans where it checks out the base commit for that PR, uses git am to apply the patch, and then merges in the 4.0.2 tag.
At this point, these are all hard-coded values in the scripts. There’s something nice about git providing traceability with version numbers and patches in the code. If a 4.1 release happens and the patch stops working, it’ll be easy to see why and go fix it. This does require a bit more vigilence in changing the code when new releases happen.
Get OTEL in there
I created a patch from the pull request and saved it into the repo.
You can do this by adding .patch to the end of the pull request URL.
Then created a script to run the git commands since the docker image used by the gitlab pipeline doesn’t have git installed (but does have docker!).
- Clone the repo
- Check out the base commit to a new temp branch
- Apply the patch as of a working commit
- Merge in the lastest tag
The reason I don’t pull the latest commit off the PR is that it’s still in progress so it may change in ways that I don’t like or may break entirely as Robb or others make changes.
At the end of these steps, we have a mastodon directory with a current release and also the Open Telemetry initializers for auto instrumentation.
This is a good start but having it in the codebase so everyone can add the important attributes will make it much more effective.
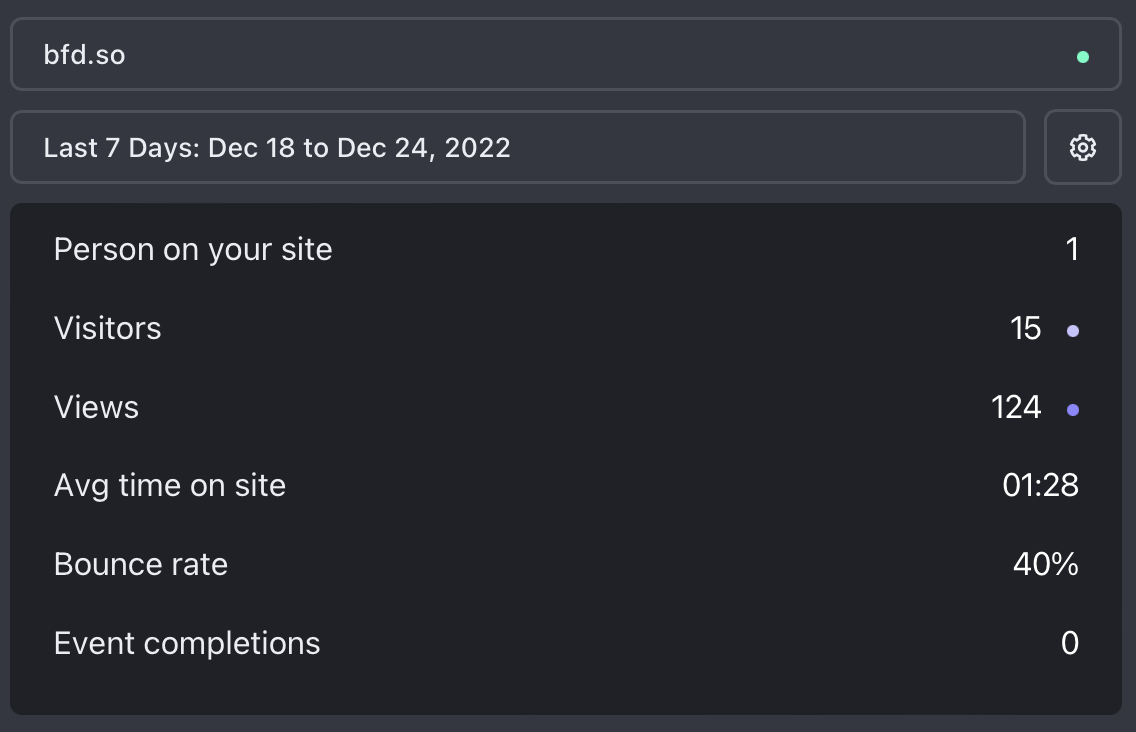
Add my Fathom Analytics SiteID
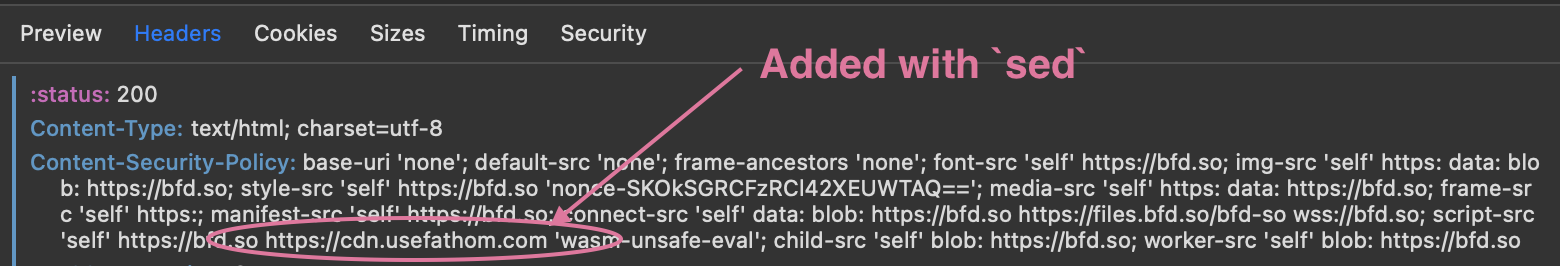
To get some analytics for browser traffic that hits the website, we need the Fathom Analytics javascript.
<script src="https://cdn.usefathom.com/script.js" data-site="ETMIOBFM" defer></script>
Since it refernces a separate domain, it’s gotta be added to the Content Security Policy (CSP) for the site also.
So with that all deployed, I can see my Fathom dashboard.
The OTEL branch needs environment variables!
One of the primary ways Mastodon is configured through the Helm Chart is via environment variables. Kubernetes makes it easy to make environment variables out of secrets and configmaps and stuff. My approach on this one is to hard code the change into the helm chart that I have locally.
- They haven’t
releasedthe helm chart so the way to use it is by cloning the repo and referencing it by directory name - It can be added as a dynamic thing and values but that complexity will be tougher to re-apply
The patch looks like this:
--- a/templates/secrets.yaml
+++ b/templates/secrets.yaml
@@ -40,4 +40,6 @@ data:
   password: "{{ .Values.postgresql.auth.password | b64enc }}"
   {{- end }}
   {{- end }}
+  OTEL_EXPORTER_OTLP_ENDPOINT: {{ "https://api.honeycomb.io" | b64enc }}
+  OTEL_EXPORTER_OTLP_HEADERS: {{ "x-honeycomb-team=API_KEY" | b64enc }}
 {{- end }}
The secrets.yaml file is just kinda jammed into all the pods that need these environment variables so it’s the perfect place to add our new configurations.
Thanks to the mustache syntax, we don’t even have to base64 encode it ahead of time.
In your deployment’s values.yaml file, the image repository and tag need to be updated and then you’re off to the races.
Either reference it by a specific good commit:
image:
  repository: registry.gitlab.com/brownfield-dev/public/images/mastodon-bfd
  tag: "8f33a073"
  pullPolicy: Always
Or you can use the tag like the Mastodon repo:
image:
  repository: registry.gitlab.com/brownfield-dev/public/images/mastodon-bfd
  tag: "v4.0.2"
  pullPolicy: Always
I’ve made the pullPolicy Always since I’ve been tweaking the pipeline a lot.
Once it settles down, I may change that back to IfNotPresent.
What we have now
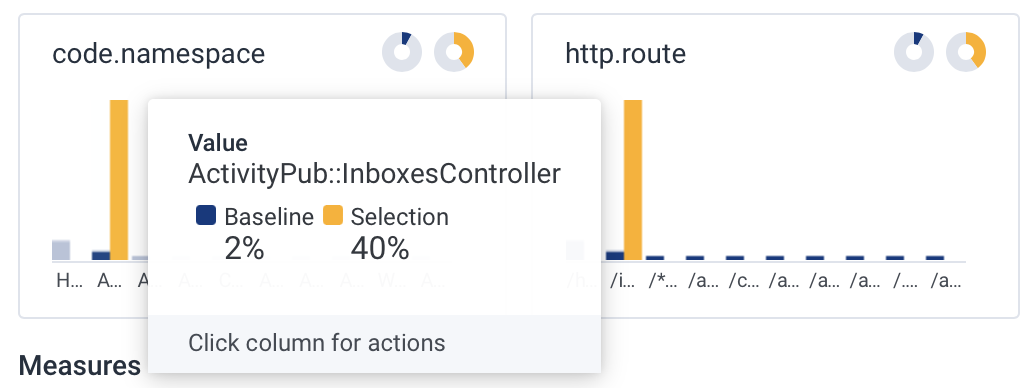
With the Open Telemetry stuff in the image and the configurations in the pod specs, we can finally see some of the telemetry.
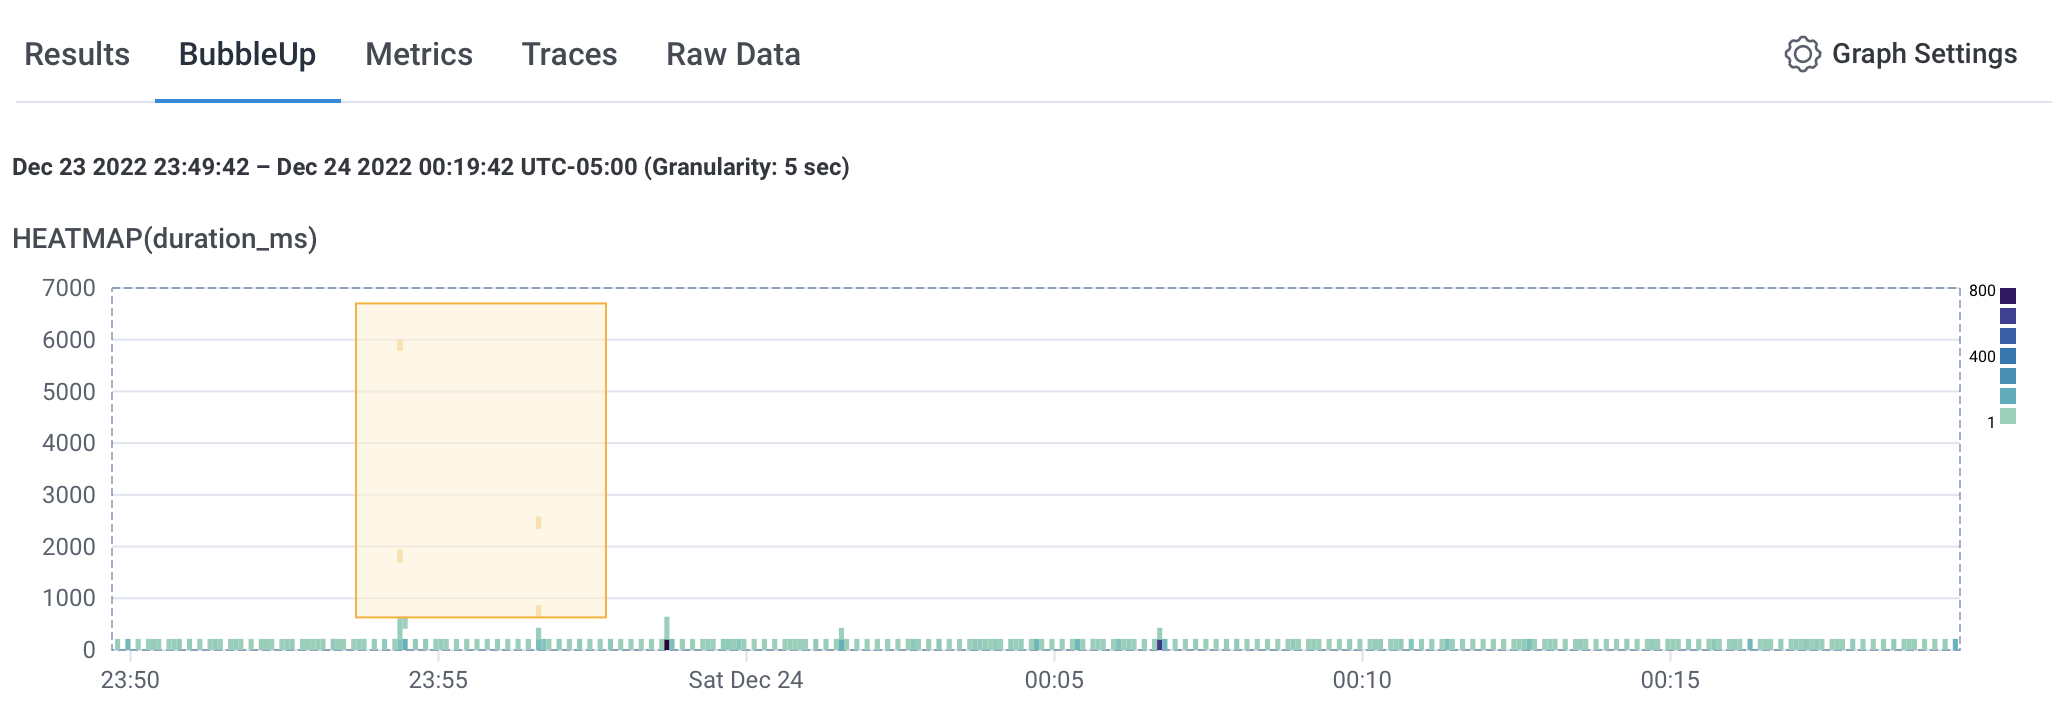
There’s an interesting set of high duration items.
This is only in the web dataset so it’s not sidekiq jobs. (or is it?!)

Now I’ll be prepared if the load increases or the efficiency decreases across versions.
Note! Don’t use this image
It has the fathom code hard-coded into the image so it’ll always report to my dashboard. That doesn’t help either of us.
Just go ahead the fork the repo, change the IDs, and enjoy!