The single-user mastodon instance that I created a while back has just been doing its thing for a while.
I didn’t add a relay so the only stuff I saw was directly followed users.
A couple of weeks ago, I added https://bigrelay.social/inbox to feed some of the hashtags I’m following.
This caused some emails to show up from Honeycomb about my usage going way up!
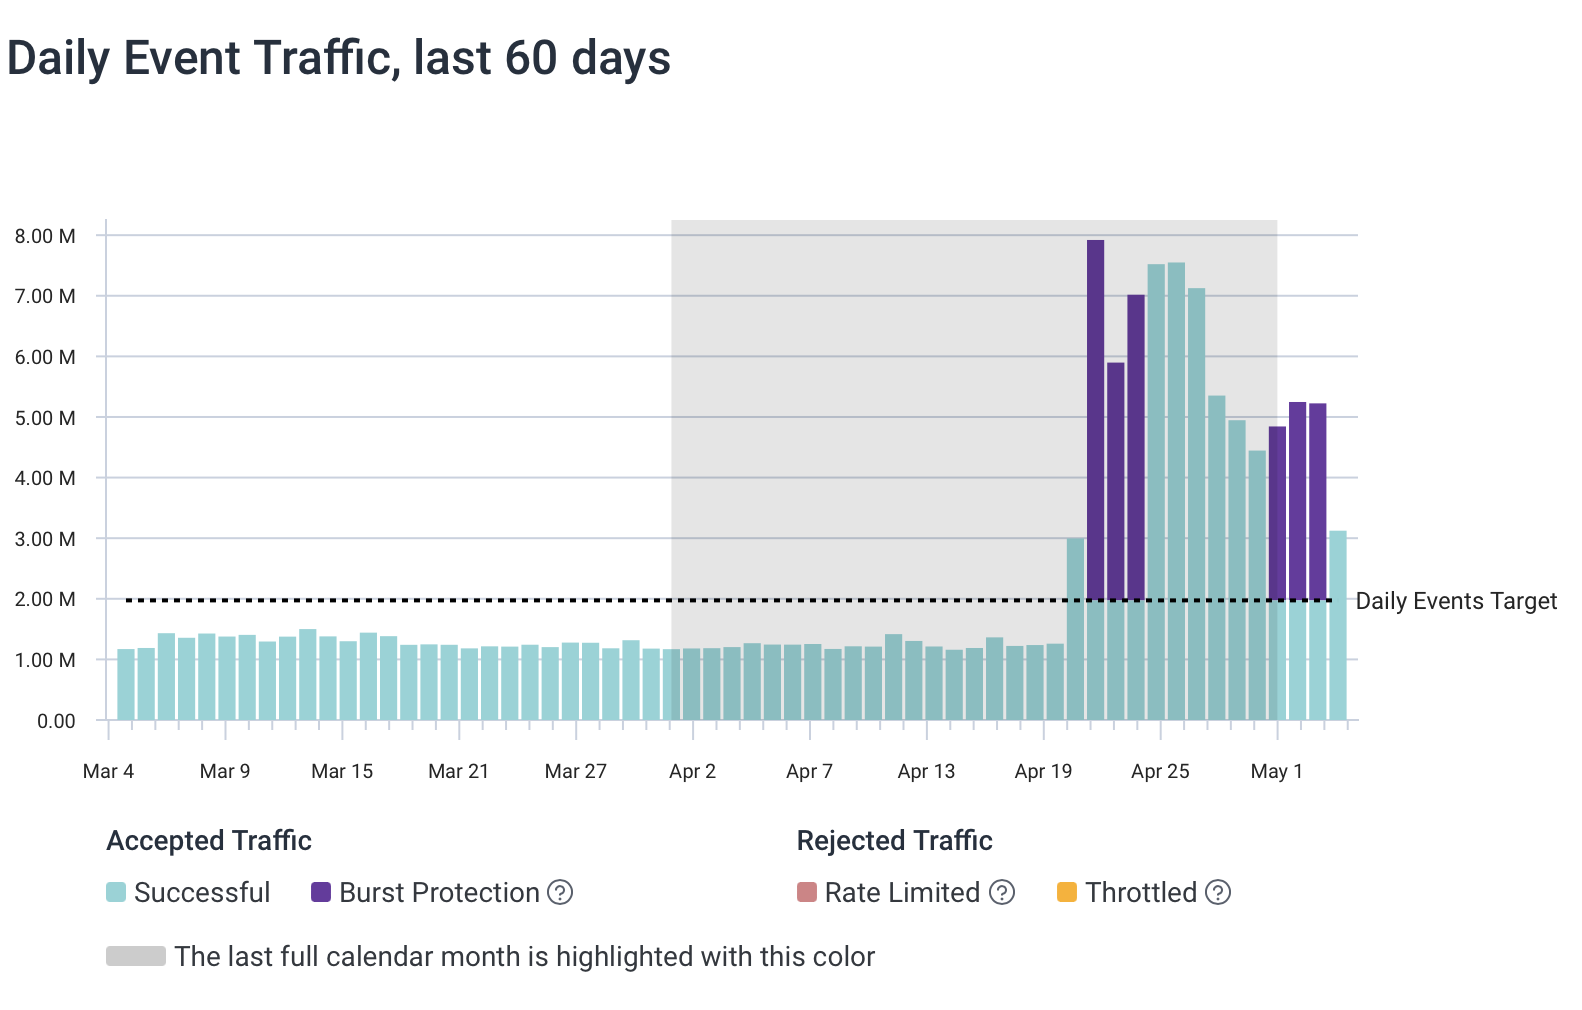
One thing Honeycomb does is forgive the excess events for a few days to give you time to deal with it without being too aggressive. It took me more than a week to get to it. Since this delay spanned the start of a new month, the forgiveness covered half the days of overage.
What to do about it?
We have a few options to reduce the amount of traffic to Honeycomb from a system.
- Deploy Refinery into the Kubernetes cluster running Mastodon and sample out some of the traces
- Deploy an OpenTelemetry Collector and filter out some of the spans
- Thin out the traces but keep the useful bits
There are benefits and drawbacks to each of these but the main drawback is the additional complexity of running another piece of software. To avoid taking on this burden, I’m not going to do 1 or 2 unless it’s really required.
Where are these events coming from?
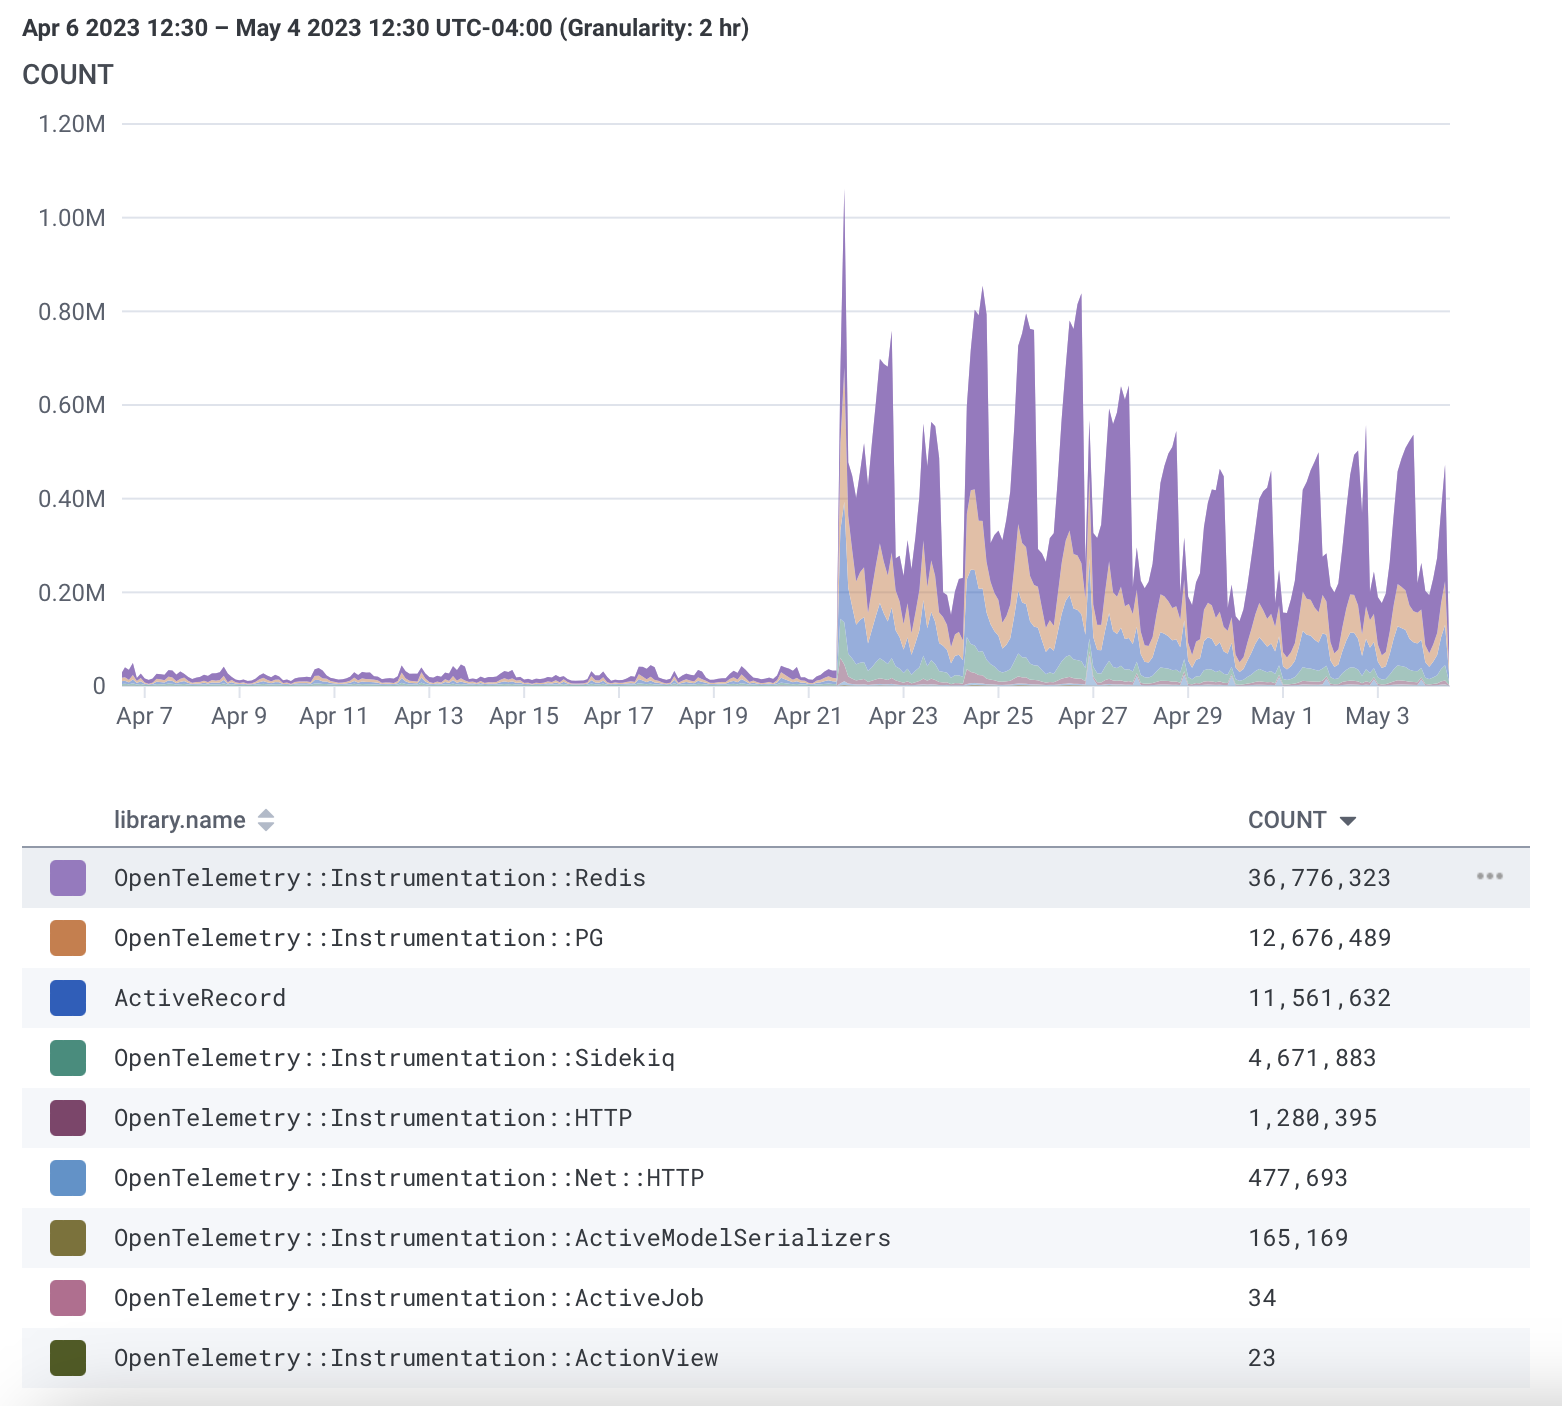
The last 28 days of spans from Sidekiq
The groups are by instrumentation.library so we can see Redis is the main offender
Over the last 2 weeks, the increase in Sidekiq activity was the primary increase in events sent to Honeycomb.
Of these, the biggest pile of spans are from Redis which is a memory cache that is accessed very frequently.
What’s in these spans?
- Durations in microseconds (less than 1/10th of a millisecond)
- Information about the instrumentation emitting the span
- Information about the process (not different from parent span)
- 2 fields about the activity:
db.systemwhich is always “redis” anddb.statementwhich isn’t very valuable.
The collection of them is interesting for someone writing the code and maintaining it. The huge amount of nearly identical queries typically indicates an N+1 issue where a set query would work better than individual queries. Since this is a memory cache rather than a real database, that may not hold true. Either way, from an operator perspective, these are not very useful.
I don’t want to code to fix this!
Thanks to some nice conventions in OpenTelemetry, most auto-instrumentation can be enabled and disabled via environment variables.
I just had to go into the sidekiq deployment in my fork of the helm chart and set the environment variable OTEL_RUBY_INSTRUMENTATION_REDIS_ENABLED to false.
After deploying, you can check it with:
$ kubectl get deploy -n mastodon-bfd mastodon-bfd-sidekiq-all-queues -o yaml | grep -A5 -B11 OTEL
        env:
        - name: DB_PASS
          valueFrom:
            secretKeyRef:
              key: password
              name: mastodon-bfd-postgresql
        - name: REDIS_PASSWORD
          valueFrom:
            secretKeyRef:
              key: redis-password
              name: mastodon-bfd-redis
        - name: OTEL_RUBY_INSTRUMENTATION_REDIS_ENABLED
          value: "false"
        envFrom:
        - configMapRef:
            name: mastodon-bfd-env
10 minutes later
Now that the redis stuff is gone, the sidekiq traces are much smaller.
What are we missing now?
Here’s a comparison of the old trace to the new trace.
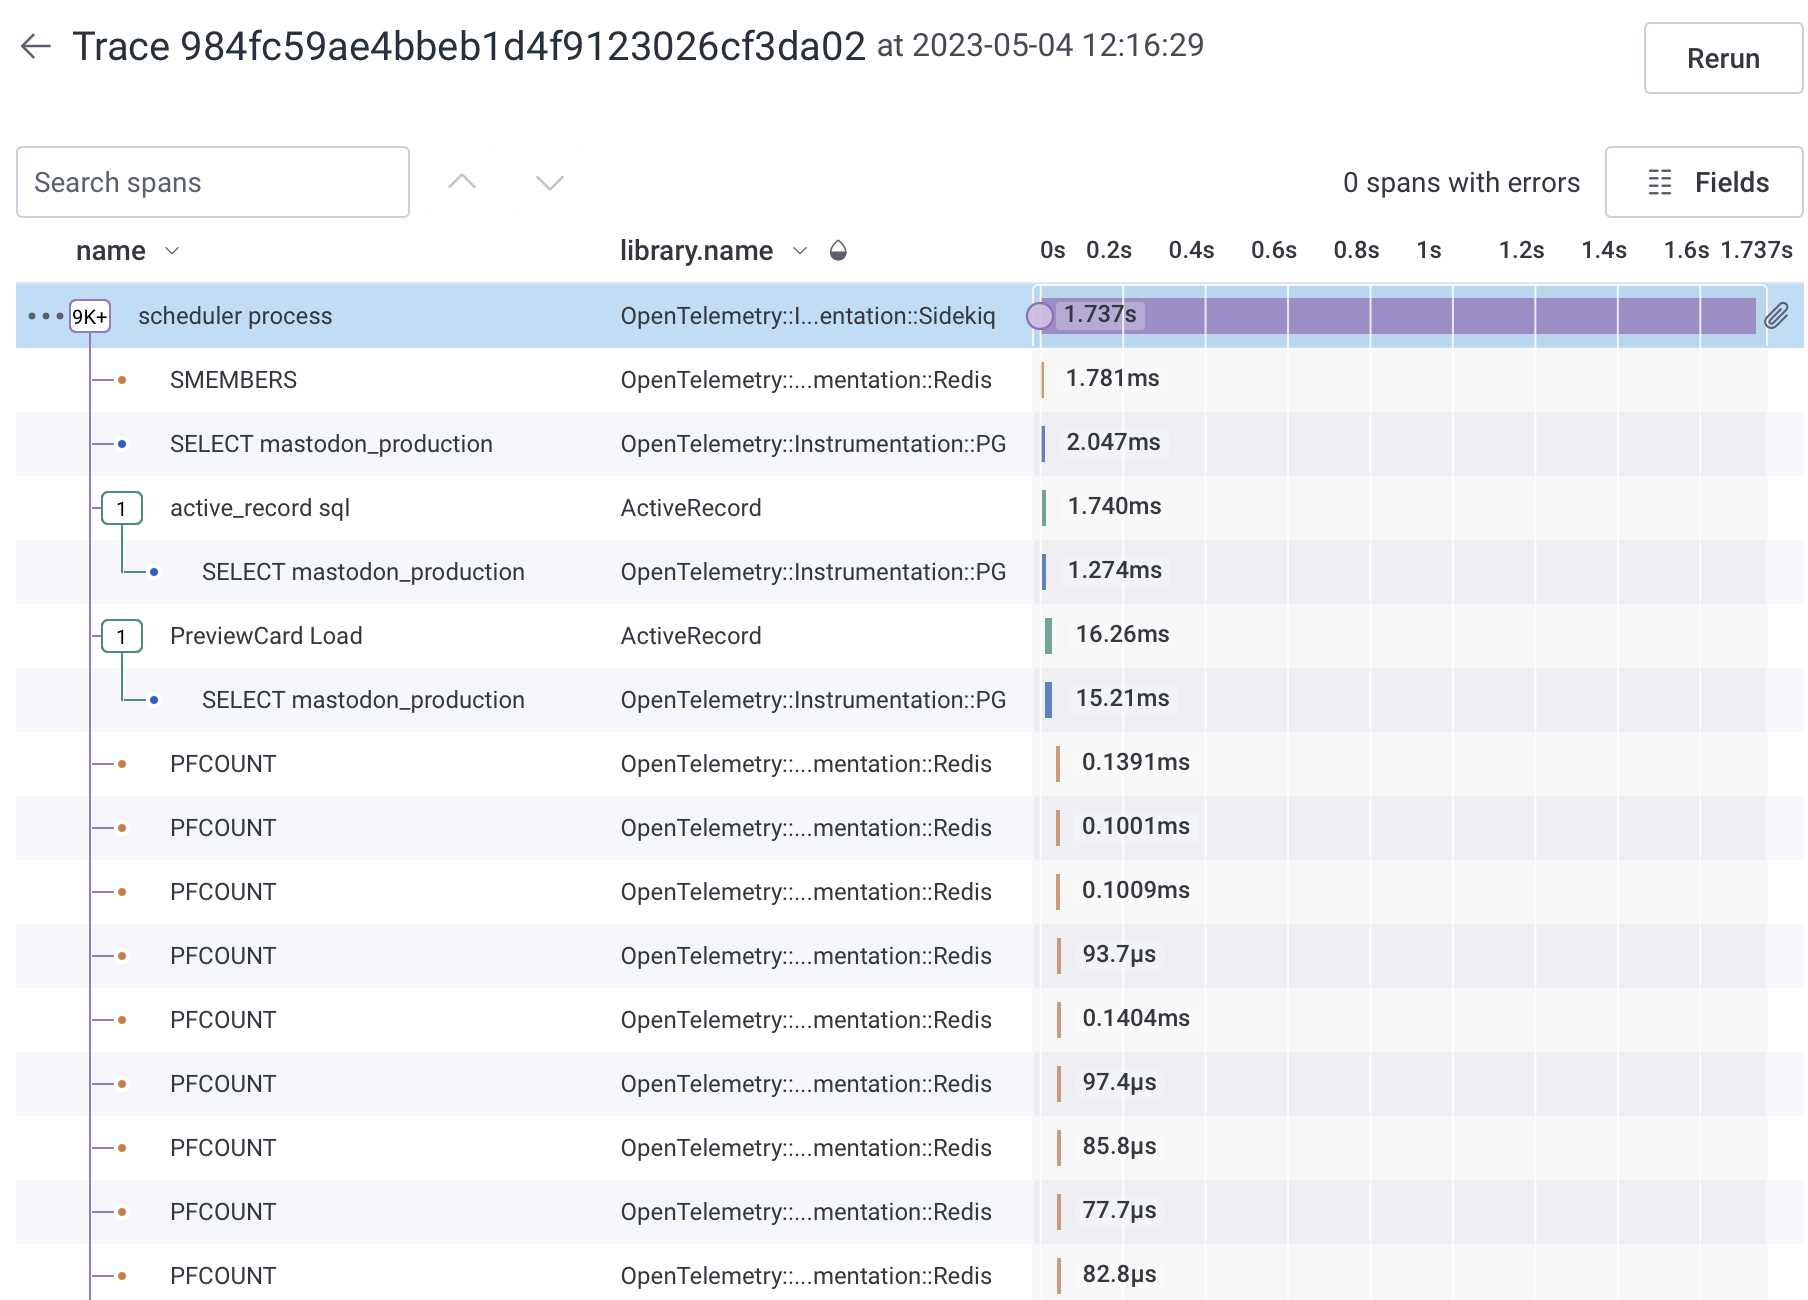
Now to look at a trace of the same activity without Redis.
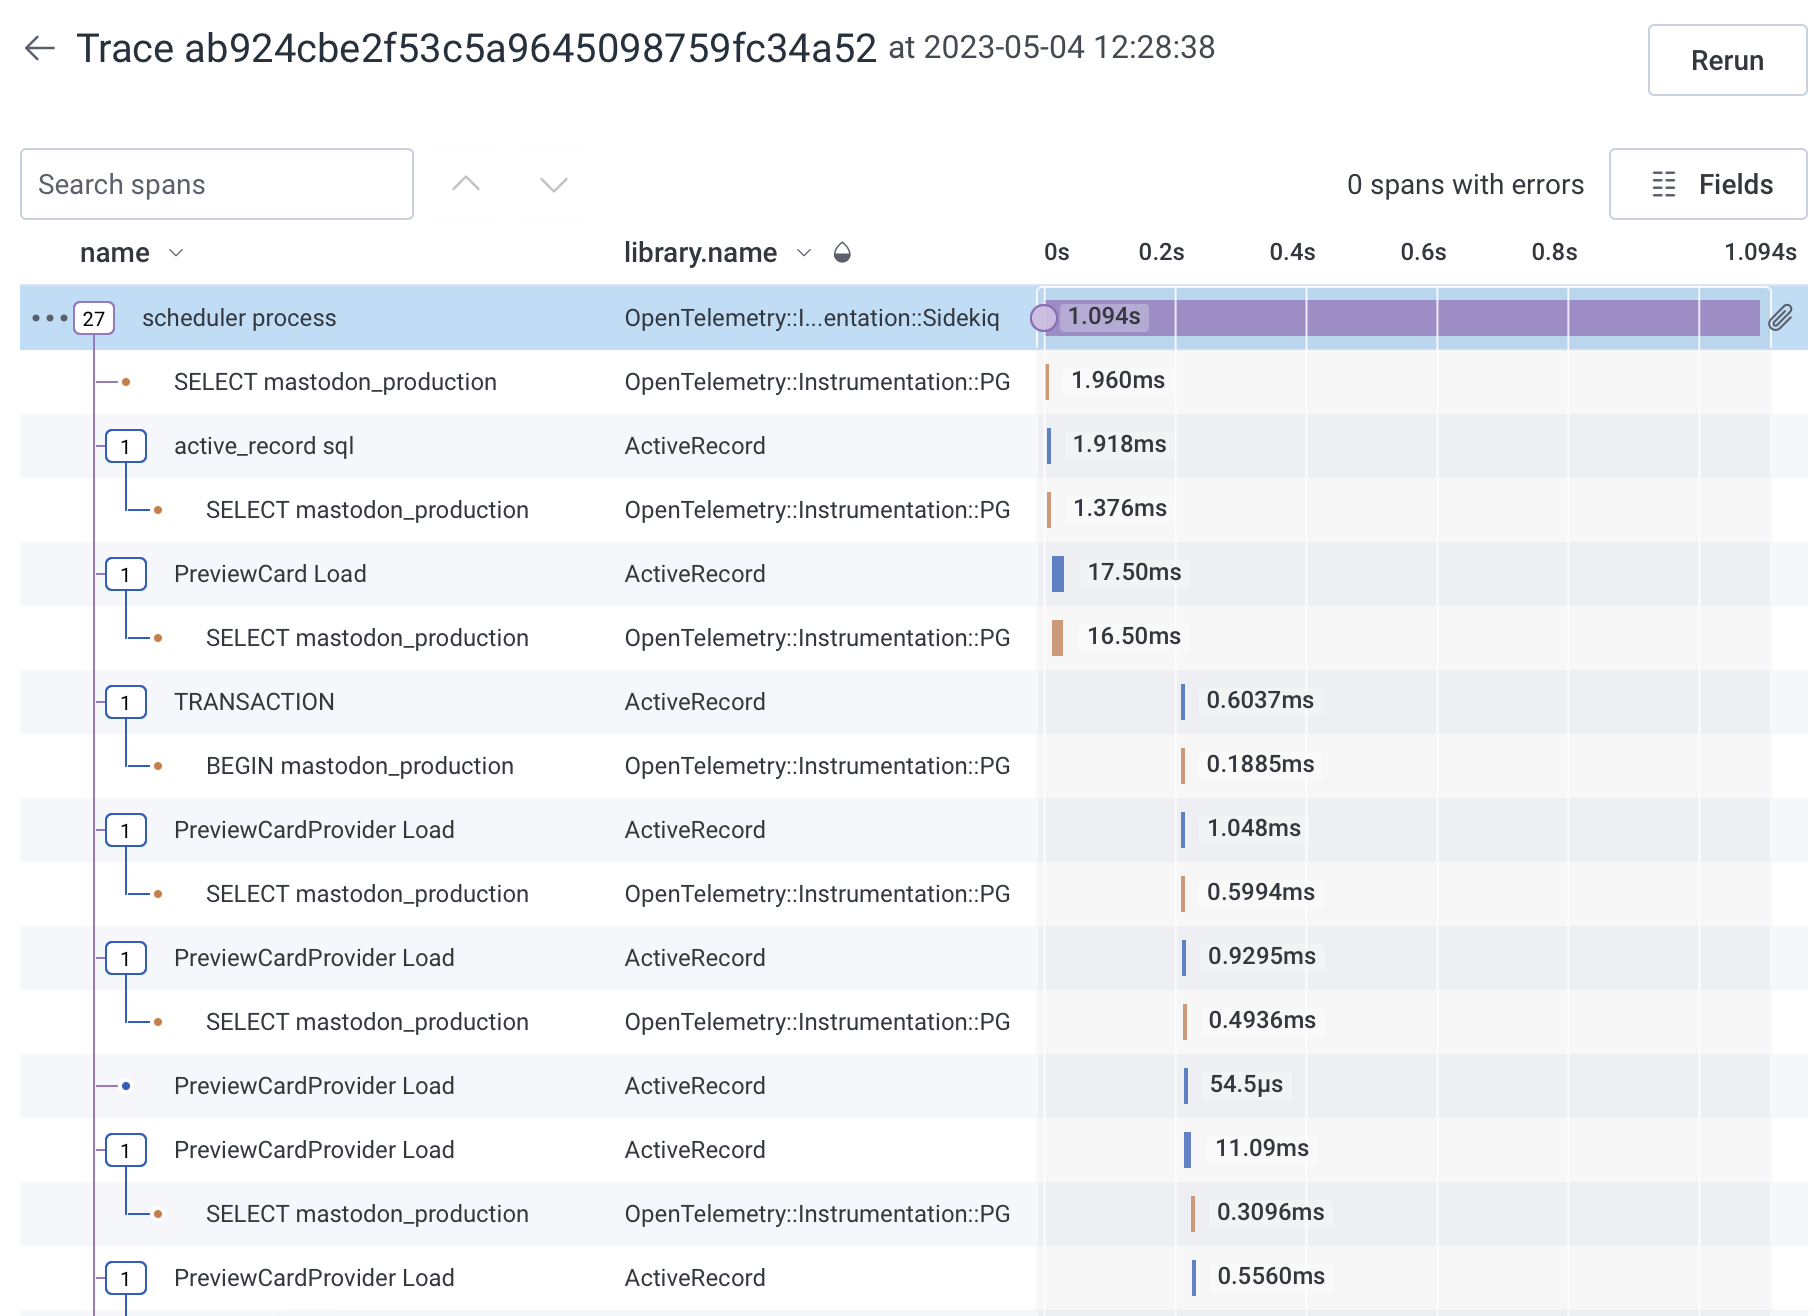
We can still probably reduce the volume of these significantly by relying on ActiveRecord rather than the mostly-duplicated postgres gem. For now we can leave that alone.
Prioritizing synchronous traffic
The changes I’ve made above are to the async, federation activities performed by Sidekiq. Some Sidekiq activities are nearly-synchronous so I don’t want to eliminate tracing entirely, but this is a nice way to get the vast majority of the value with a fraction of the events.
All of the instrumentation is still enabled on the web and streaming pods since they have a separate set of environment variables.
The extra noise from the redis calls there isn’t enough to benefit greatly from removing them.
If the instance suddenly starts getting a huge amount of additional web traffic, I will revisit that.
Probably a week or 2 after getting alerts from Honeycomb about excessive event volume.
Reviewing a few hours later
I asked Honeycomb to show me how many spans were coming through vs how many traces were coming through. Then I had it pop up the comparison to a week ago (to preserve time-of-day fluctuations).
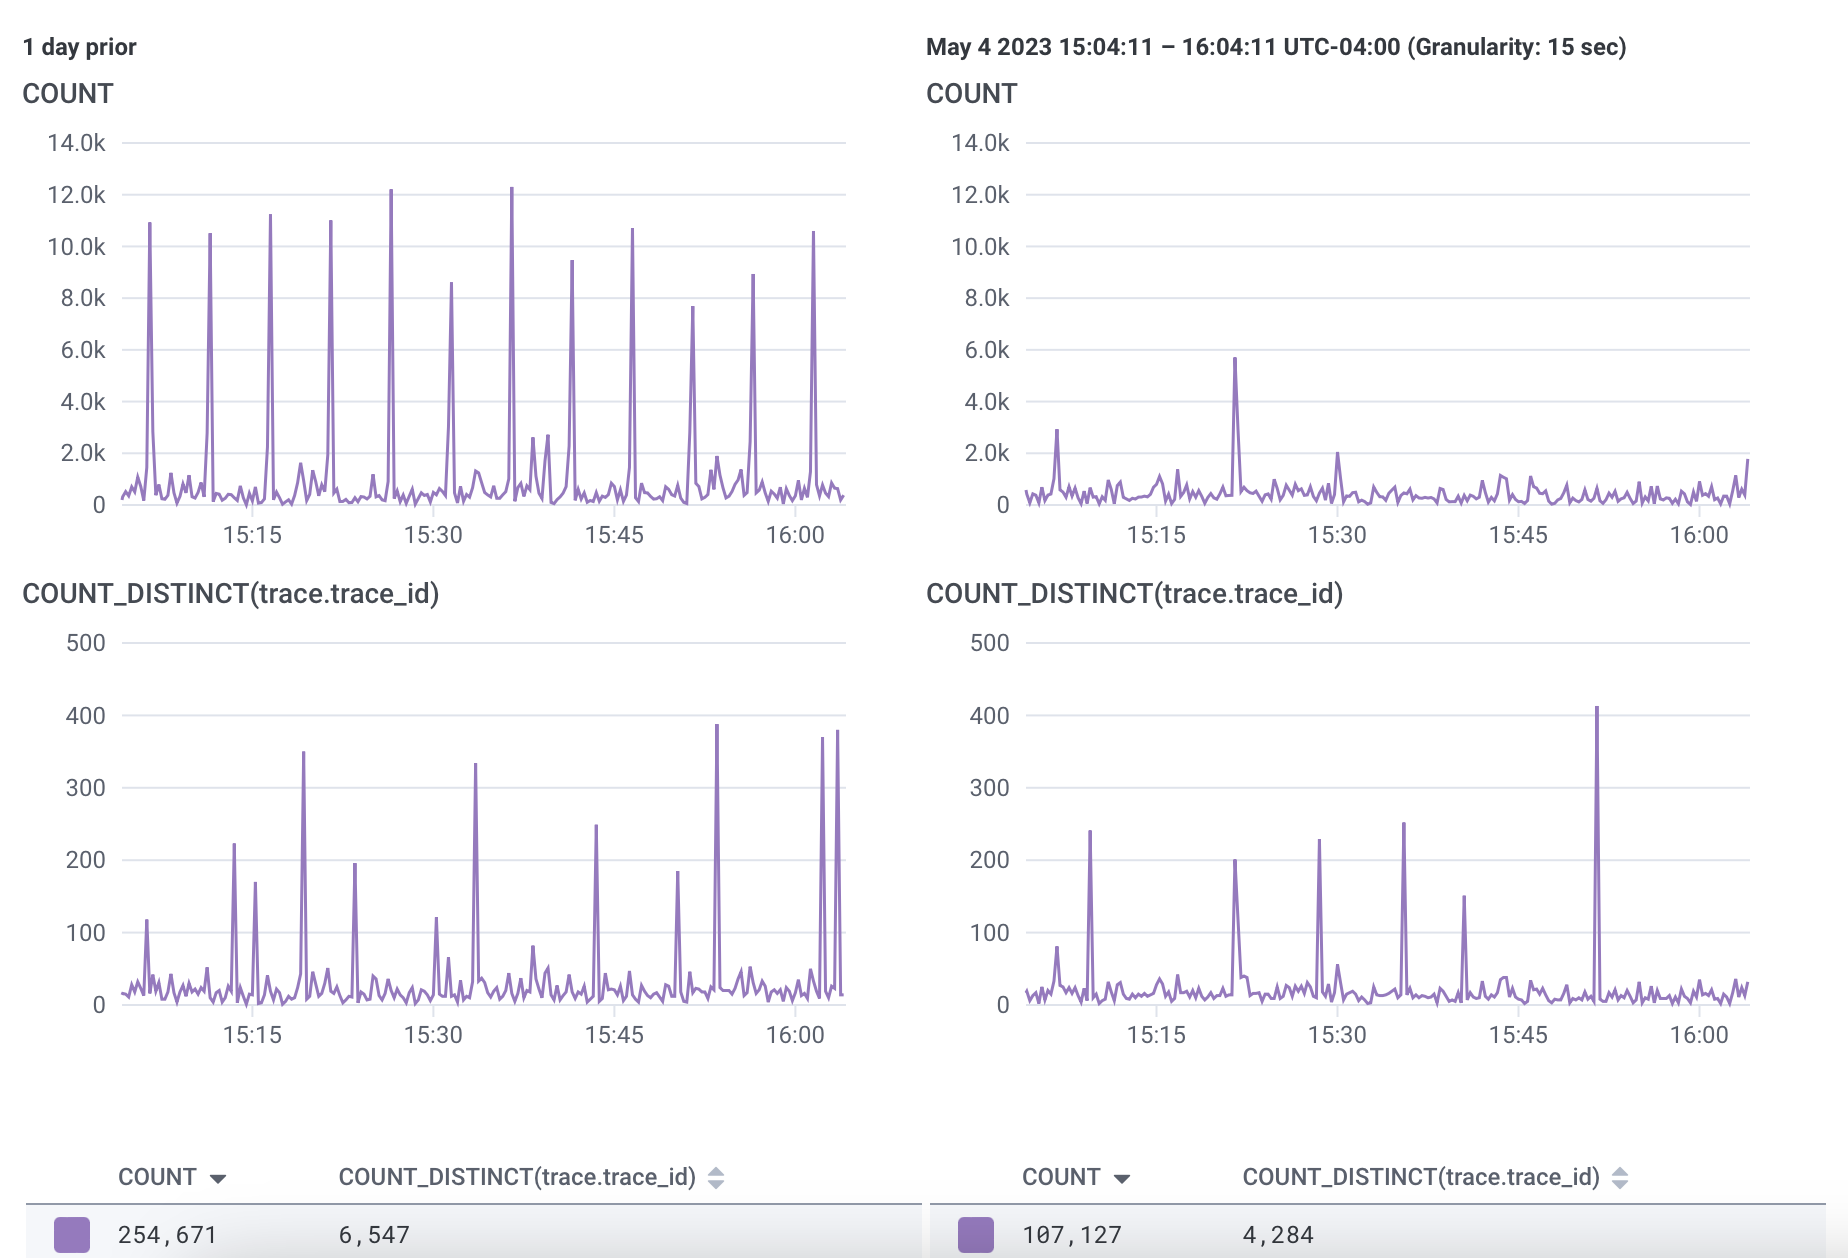
Trace count is the same, spans are reduced by 60%
We don't want fewer traces so this looks like the change is working
Now we have fewer low-value events per trace with the same number of traces.
Perfect.
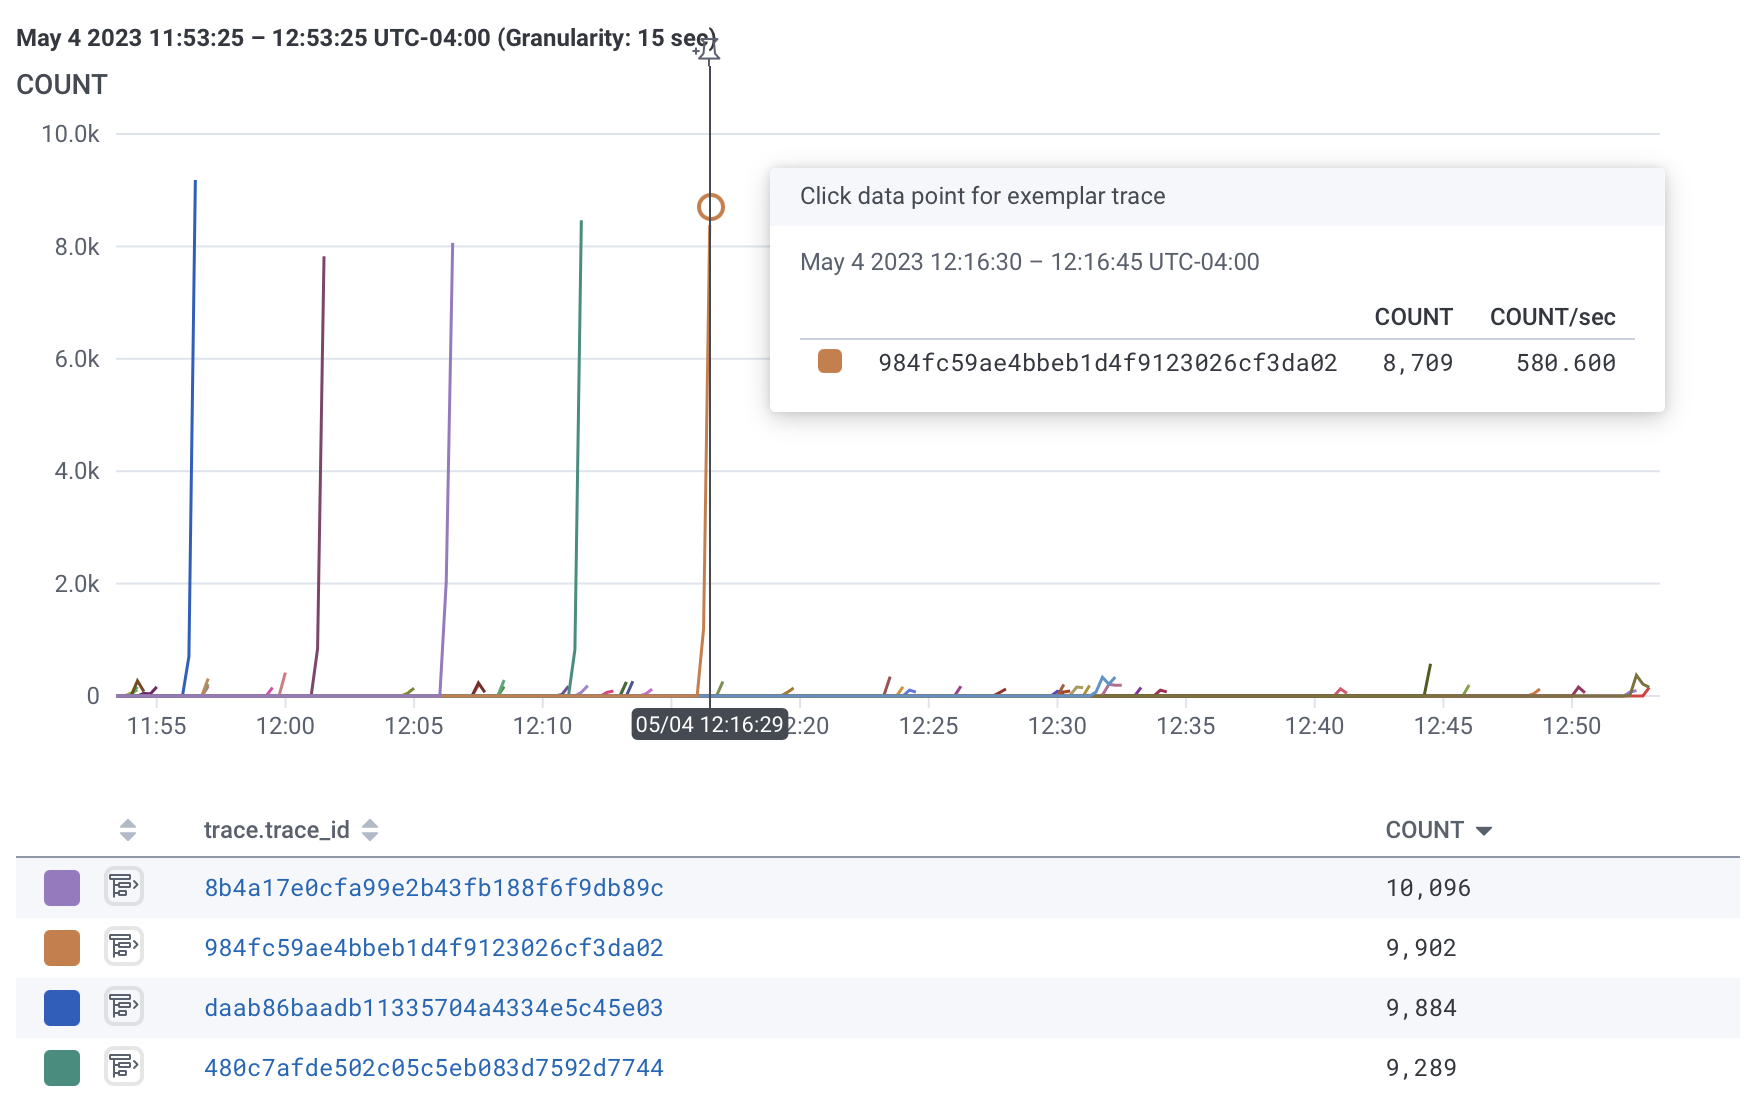
What about web traffic?!
Running the same report as above on all the data, including infrastructure metrics and everything else shows only 50,000 more spans over the course of an hour. That’s like 13 eps where the problems were coming in batches of 8000+ spans in a single 30-second trace.