Everyone’s newest report is Claude and the dude is a machine.
We really need to get a sense of what this guy is up to. Testing out ideas. Building really low quality designs. Writing the most boring and awful prose.
But the Claude in my IDE is just the one I can see. While I’m busy watching him, there’s another one picking up tickets and opening PRs. One reviewing all the PRs. One fixing the build when it goes red. I thought I hired a coworker. I staffed a whole department — and every one of them is shoving inputs into the same pipeline I’m on the hook for.
How much is it moving the team forward? The Company? And at what cost?
The frame
You can’t answer “at what cost” by squinting at one chat window at a time. You get at it by treating the whole operation as what it already is — a production line that runs left to right. An idea shows up, gets shaped into code, gets built and tested, ships, runs in production, throws off problems, and the problems turn into the next idea. Value moves down the line and loops back to the start.
What’s different this year is that every station on that line is imbued with AI. The engineer pairs with an assistant in the IDE. A ticket gets handed to an agent that opens its own PR. CI doesn’t just compile and test — a chunk of the interesting jobs are LLM calls reviewing the diff. And the thing running in production is itself an agent, investigating incidents for Honeycomb’s users.
That’s fine right up until you can’t see any of it. An AI that writes code, reviews it, fixes the build, and investigates incidents is four new places where “it seemed fine” quietly stands in for “here’s what happened.” So we did the boring thing we’d tell anyone else to do: instrument every station with OpenTelemetry and point it at our own backend, Honeycomb.
What follows is what opened up once the signal was flowing. Instrumenting is step one and the least interesting step. I’m going to walk the line station by station — what each one emits, what that let me see, and the thing I went and changed because of it.
                    THE PIPELINE  →  value flows left to right
   ┌──────────┐   ┌──────────┐   ┌──────────┐   ┌──────────┐   ┌──────────┐
   │  IDEA /  │   │ CREATE & │   │ HANDOFF  │   │ BUILD &  │   │ OPERATE  │
   │  TICKET  │──▶│  MODIFY  │──▶│ ticket → │──▶│  TEST    │──▶│ AI agent │
   │          │   │   IDE    │   │  agent   │   │ CI: some │   │ runs in  │
   │          │   │ AI pair  │   │ opens PR │   │ jobs are │   │  PROD    │
   │          │   │          │   │          │   │   LLMs   │   │          │
   └──────────┘   └────┬─────┘   └────┬─────┘   └────┬─────┘   └────┬─────┘
        ▲              │ emit          │ emit         │ emit         │ emit
        │              ▼               ▼              ▼              ▼
        │   ╔════════════════════════════════════════════════════════════════╗
        │   ║   OBSERVABILITY BACKEND  —  all OTel, all gen_ai.* semconv     ║
        │   ║   ┌── see ──┐   ┌── ask ──┐   ┌── act ──┐   ┌── automate ──┐   ║
        │   ║   │ what's  │   │ cost?   │   │ fix the │   │ alert · eval │   ║
        │   ║   │ really  │──▶│ which   │──▶│ prompt, │──▶│ score · gate │   ║
        │   ║   │ happen- │   │ model?  │   │ the     │   │ feed back    │   ║
        │   ║   │ ing     │   │grounded?│   │ hook    │   │ into pipeline│   ║
        │   ║   └─────────┘   └─────────┘   └─────────┘   └──────────────┘   ║
        │   ╚════════════════════════════════════╪═══════════════════════════╝
        │                                        │
        │         the trajectory: instrument ─▶ see ─▶ question ─▶ act ─▶ automate
        │                                        │
        └────────────────────────────────────────┘
              production signal becomes the next idea  (the loop closes)
Note the Rube Goldberg machine of arrows looping back on the left. That’s the part nobody’s wired up yet.
Also I’ll disclose here that ASCII and even iPad pen is no match for Honeycomb’s use of agents within the product and our two-tier deployment where the dogfood agent is distinct from the production one. It’s hurting my brain in word format so I’ll leave it there. This diagram is very simplified.
Station 1 — Create & modify: the IDE
This is where work enters the line — an engineer turning intent into a diff, with an assistant riding along.
Modern assistants expose hook events: session start, prompt submit, pre-tool-use, and the rest. That’s already the granularity you’d want for observability, so a small plugin subscribes to the hooks and emits OpenTelemetry spans as they fire. We run the same instrumentation against more than one assistant and land each in its own dataset under shared gen_ai.* conventions, which means I can compare tools head to head instead of by gut feel. Per session it picks up which instruction files loaded, which agent ran and of what type, every tool call and how it went, the model, tokens, cost, commits and PRs attributed back, and time-to-first-token. Prompt bodies are opt-in.
Then you look, and the first thing that falls out is that this isn’t one model doing everything. Trailing seven days, one assistant’s dataset logged about 91,000 completions across eight models — a portfolio, with the heavy models saved for the hard work and a cheap, fast one mopping up the long tail:
| Model tier | Completions (7d) |
|---|---|
| Flagship (largest) | ~37,000 |
| Mid / balanced | ~24,000 |
| Fast / cheap | ~12,000 |
| Specialized + prior generations | ~18,000 |
The question we actually wanted answered was dumber and more useful: did the assistant read our coding-standards file, and did it honor a MUST? Before the telemetry that was a vibes argument and I’d have lost it politely. With it the answer was flat — the MUST was being treated as a suggestion, and the instruction file wasn’t even loading in most sessions.
Writing a sterner sentence and hoping wasn’t working. The constraint moved out of a document the model is free to ignore and into a pre-tool-use hook that blocks the disallowed action outright. You can only make that call — and check that it stuck — once you can see the behavior. Observed it on Monday, argued from data by Friday, enforced it in code the week after.
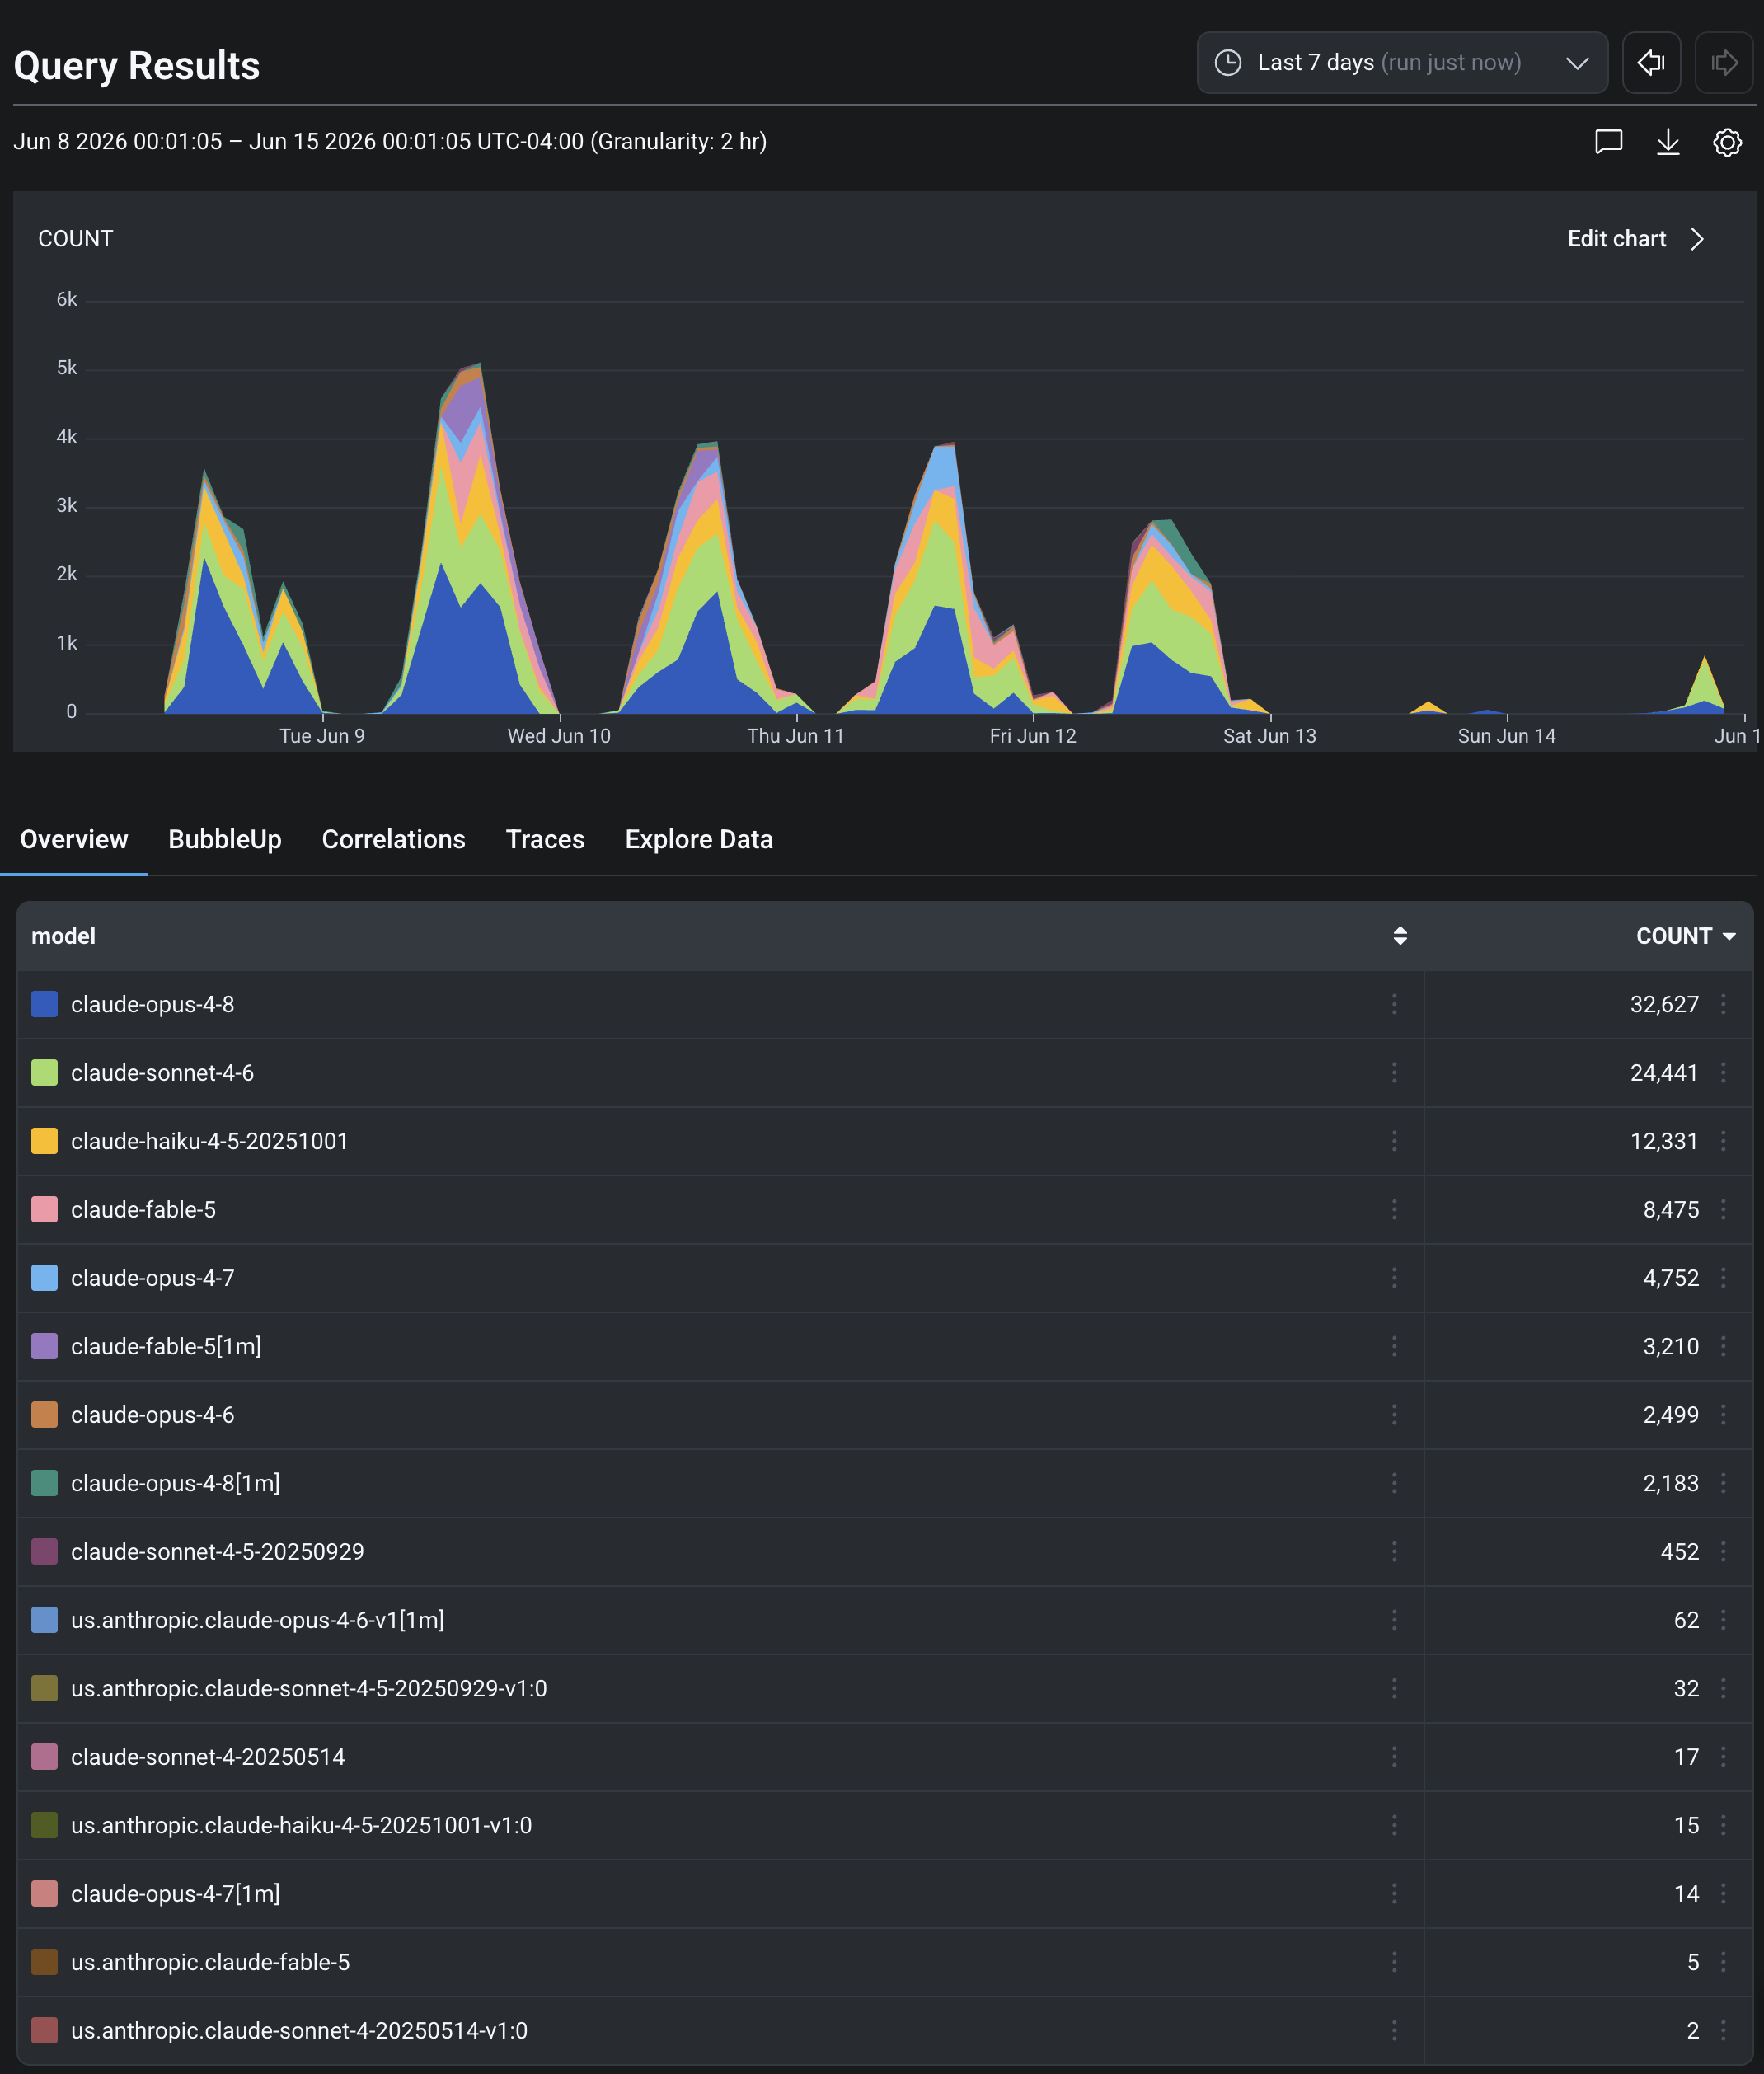
One week of Claude Code models
This shows the number of completions for each model called by Claude Code.
Station 2 — Handoff: ticket → coding agent
This station didn’t exist 4 months ago. Instead of a human grabbing the ticket, you hand it to an agent and the agent opens the PR.
Under the hood it’s several agentic workflows wearing one trench coat, each a CI workflow file triggered from somewhere different:
- Coding agent — you delegate a ticket, a webhook fires, a dispatch service routes it, and a CI job runs the assistant against the ticket. It opens a draft PR, answers PR comments, and fixes its own CI failures.
- PR-review agent — fires when a PR opens or someone comments, reviews the diff against criteria, posts the review. It has subtypes: general, framework-specific, dependency-bump, and others.
- Fix-the-build agent — one narrow job: repair a broken main, reverting if it has to, when CI goes red.
The agent invocation is a plain shell line, not a black box, and its status, exit code, and decisions get written onto the span. It also runs behind a network egress fence — a privileged process with access to private repos can’t phone home — and that fence is itself observable.
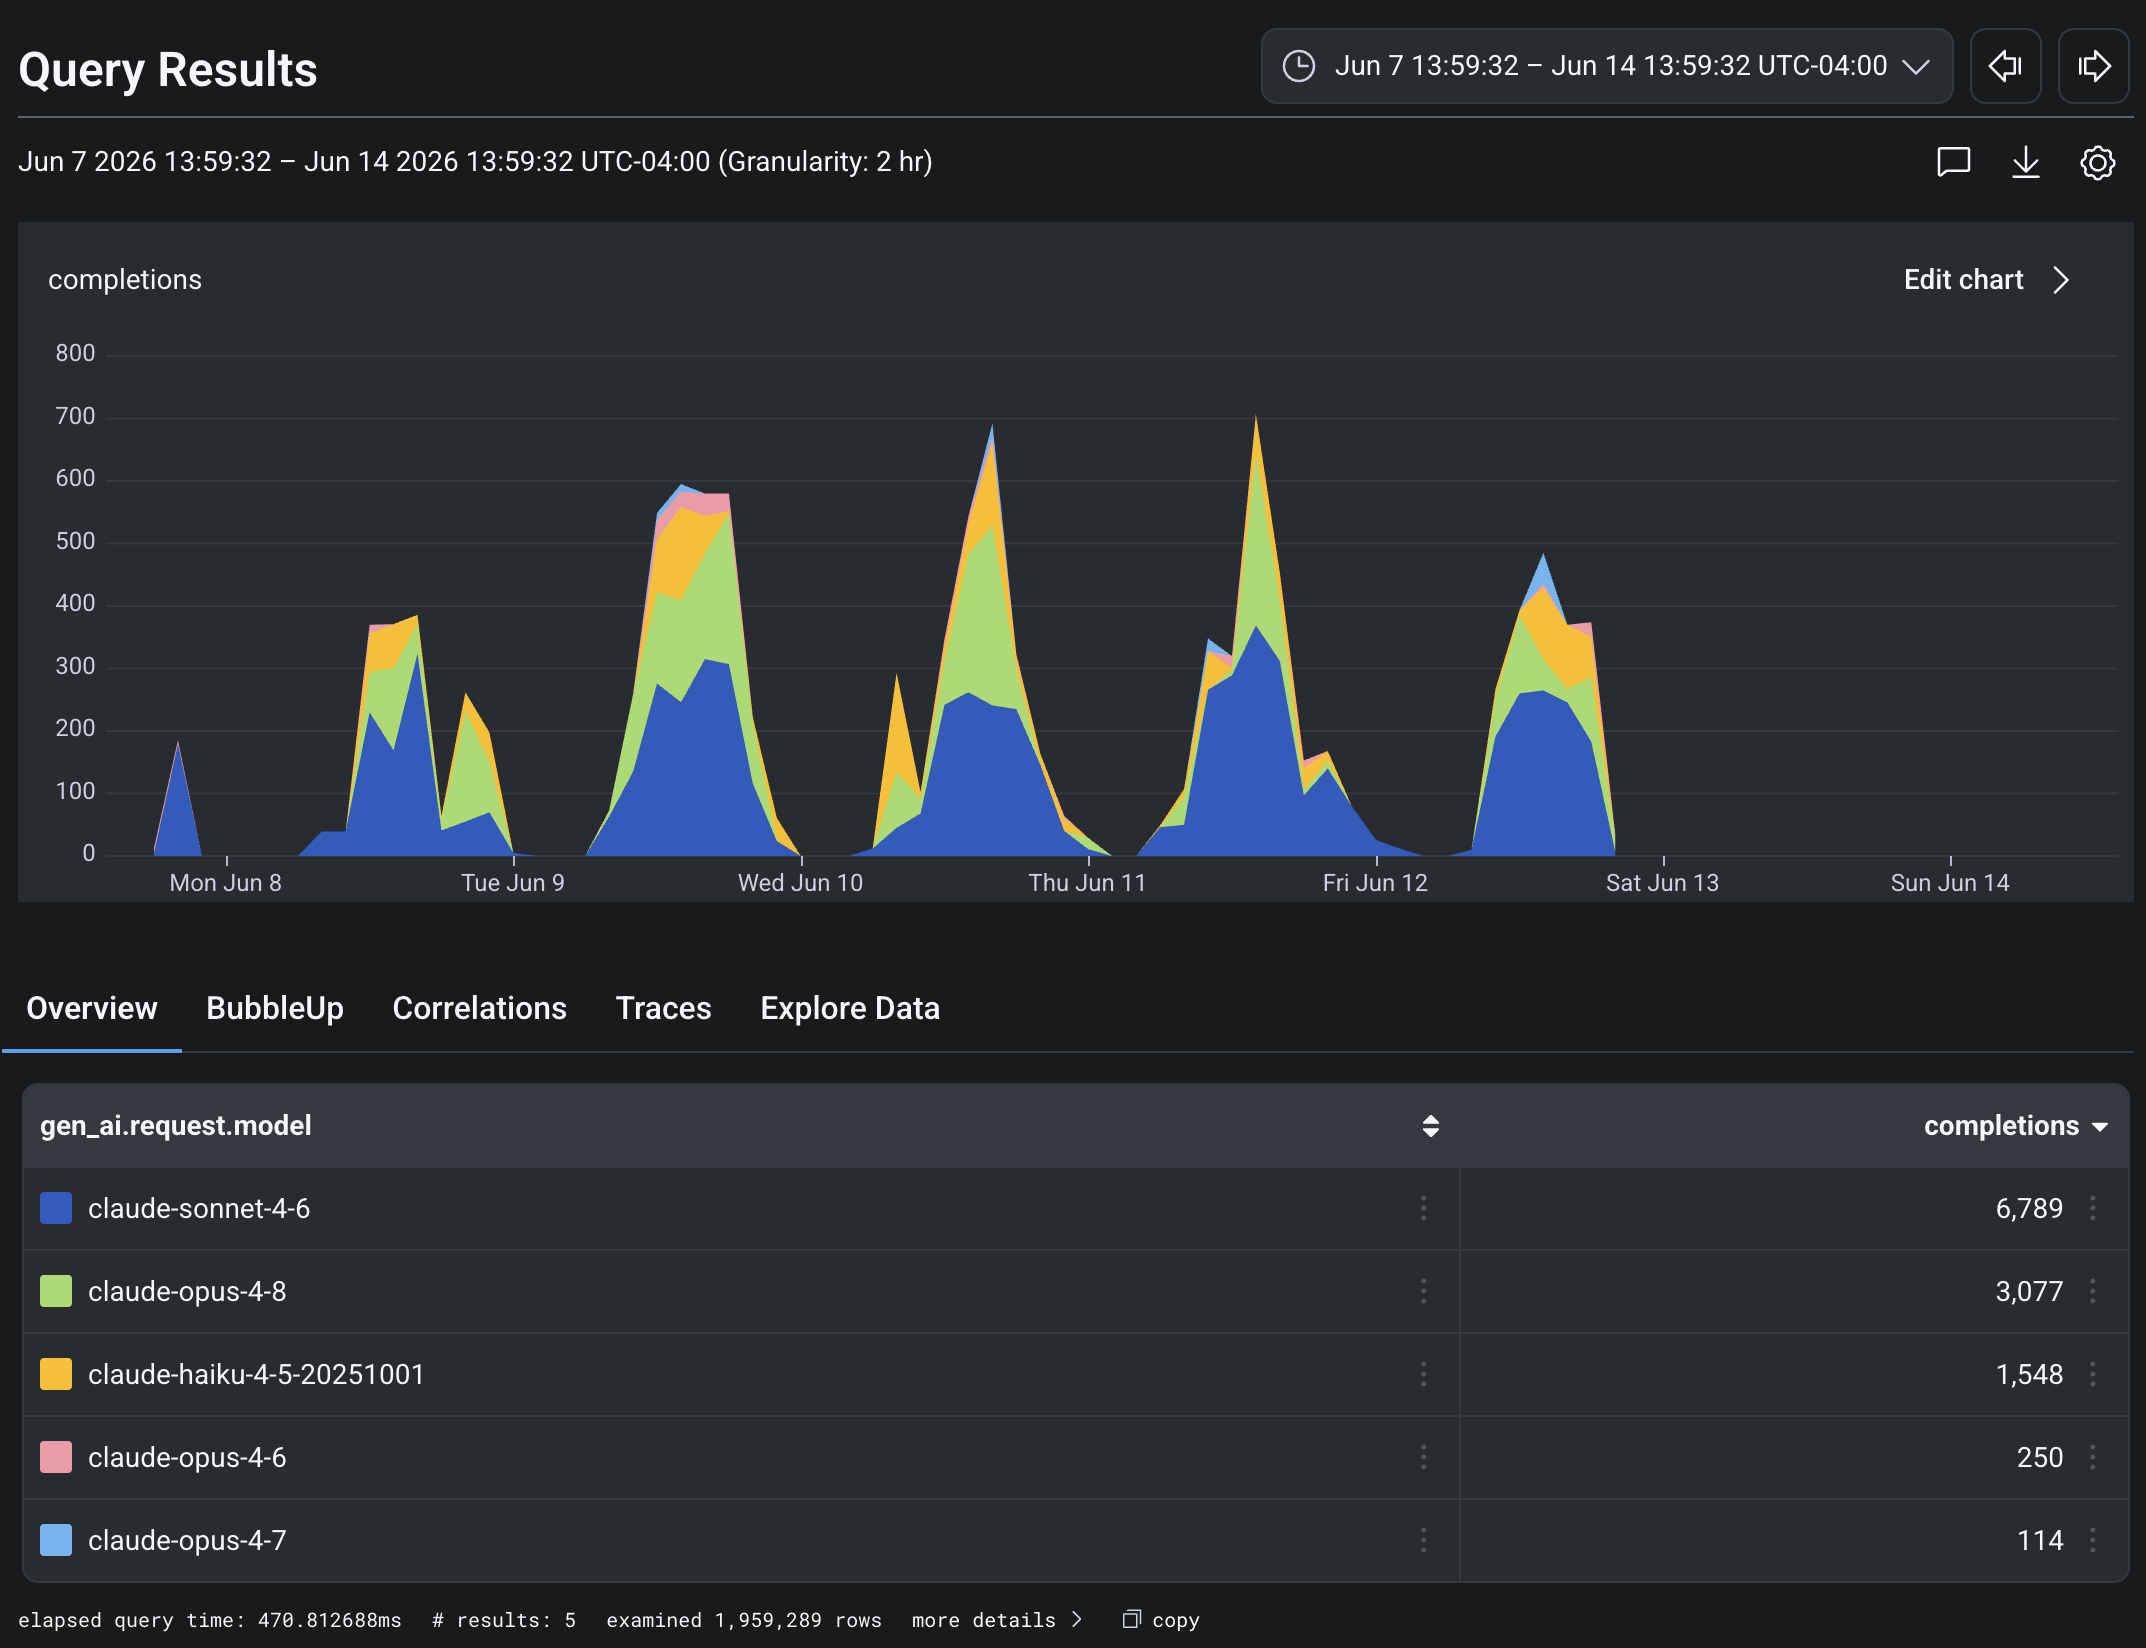
Trailing seven days: about 1,200 coding-agent runs holding roughly 12,000 completions. The model mix leans heavier than the IDE’s, which makes sense — an agent running with nobody watching reaches for the more capable model and saves the cheap one for internal judging. Review work splits cleanly by type, so I can see how much goes to general review versus framework-specific versus dependency bumps.
Two questions came up the same week, both answered by pulling a trace instead of reading logs. “Why did this run take 28 minutes?” was a ten-minute dependency install buried in the middle of it. “Why are my PRs only ever coming back success?” was a webhook subscribed to the wrong event type. Neither shows up in a log line; both are obvious the second you look at the shape of the trace.
The one attribute that earned its keep: tag every run with the human who kicked it off. Now an engineer can filter to the runs I started and see exactly what the agent decided and which tools it reached for. That turns a fleet of autonomous runs into something a person can actually audit and steer.

Shows an autobot run as a waterfall
The trace is 6 minutes and 11 seconds long, shows a 4 minute long agent run after some pre-work. Lots of egress tracking.
Station 3 — Build & test: CI, increasingly LLM-shaped
The diff flows into CI. Some of CI is exactly what you’d expect. A growing slice of it is not.
The expected part is a normal trace tree for every run — clone, dependency download, compile, lint, unit tests, security scan, asset deploy, and a couple dozen more steps. Trailing seven days, something like 10,000 pipeline and build runs.

The new part is that a whole set of CI jobs are LLM calls, emitting into the same environment: the coding-agent and PR-review workflows from the last station, the dispatch and egress-fence services (the dispatcher alone logged hundreds of thousands of routing spans in a week), and a review-feedback workflow that captures the thumbs-up/thumbs-down telling us whether a review was any good. So one CI run graph holds both kinds of work — a deterministic compile job can sit right next to a chat <model> job, both under the same pipeline.
Because it’s all OpenTelemetry with one set of conventions, a model name means the same thing whether it came off a laptop, an autonomous run, or a CI review job. Cost is cost, a tool call is a tool call. That lets me ask something that wouldn’t have parsed a year ago — how much of our CI time and spend is model inference versus compilation? — as one query instead of a research project.
Sticking to the GenAI conventions wasn’t tidiness for its own sake. It’s what unlocks the agent-native views — timelines, agent waterfalls — on top of the raw traces. A flashier proprietary trace format was on the table and it didn’t follow the conventions; taking it would have meant giving those views up. We reconstructed the spans to keep convention parity instead. The instrumentation call and the product capability turned out to be the same call.
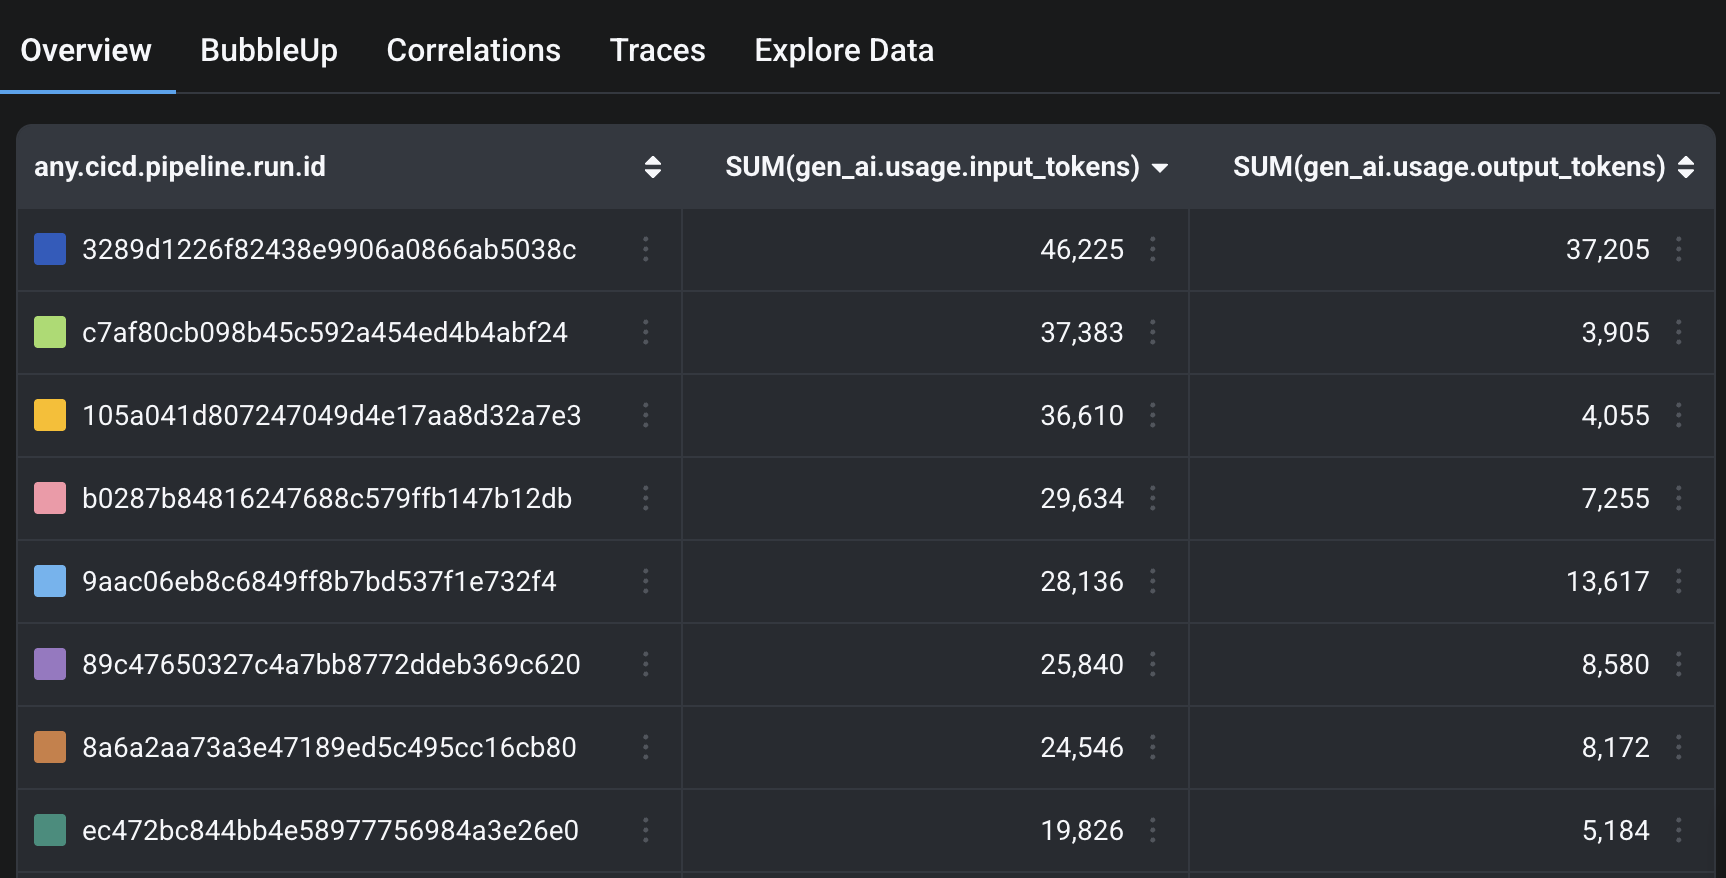
Shows the jobs with the most token burn
From here, we can dive directly into the job. Which PR it was on, who was working on it, and anything else to improve the outcome.
Station 4 — Operate: the product is an agent too
The diff shipped, it’s in production, and part of what’s running is itself an agent. Our AI investigation feature runs thousands of autonomous investigations a week against live telemetry. This is the final station and the place the line bends back on itself — the agent’s whole job is to turn production signal into understanding.
Every investigation spans multiple traces, but gen_ai.conversation.id is stable across the traces. The span names still capture the persona and activity:
investigatorroothypothesis-investigatorsub-agents- a tool-execution span each time it runs a query (by a wide margin the highest-volume tool)
- spans for the artifacts it writes
Plus the timing landmarks an agent product lives or dies on: time to first token, time to first tool use, generation start.
Trailing seven days: about 7,200 top-level investigations and 3,500 sub-agent investigations, on the order of 72,000 query calls underneath them.
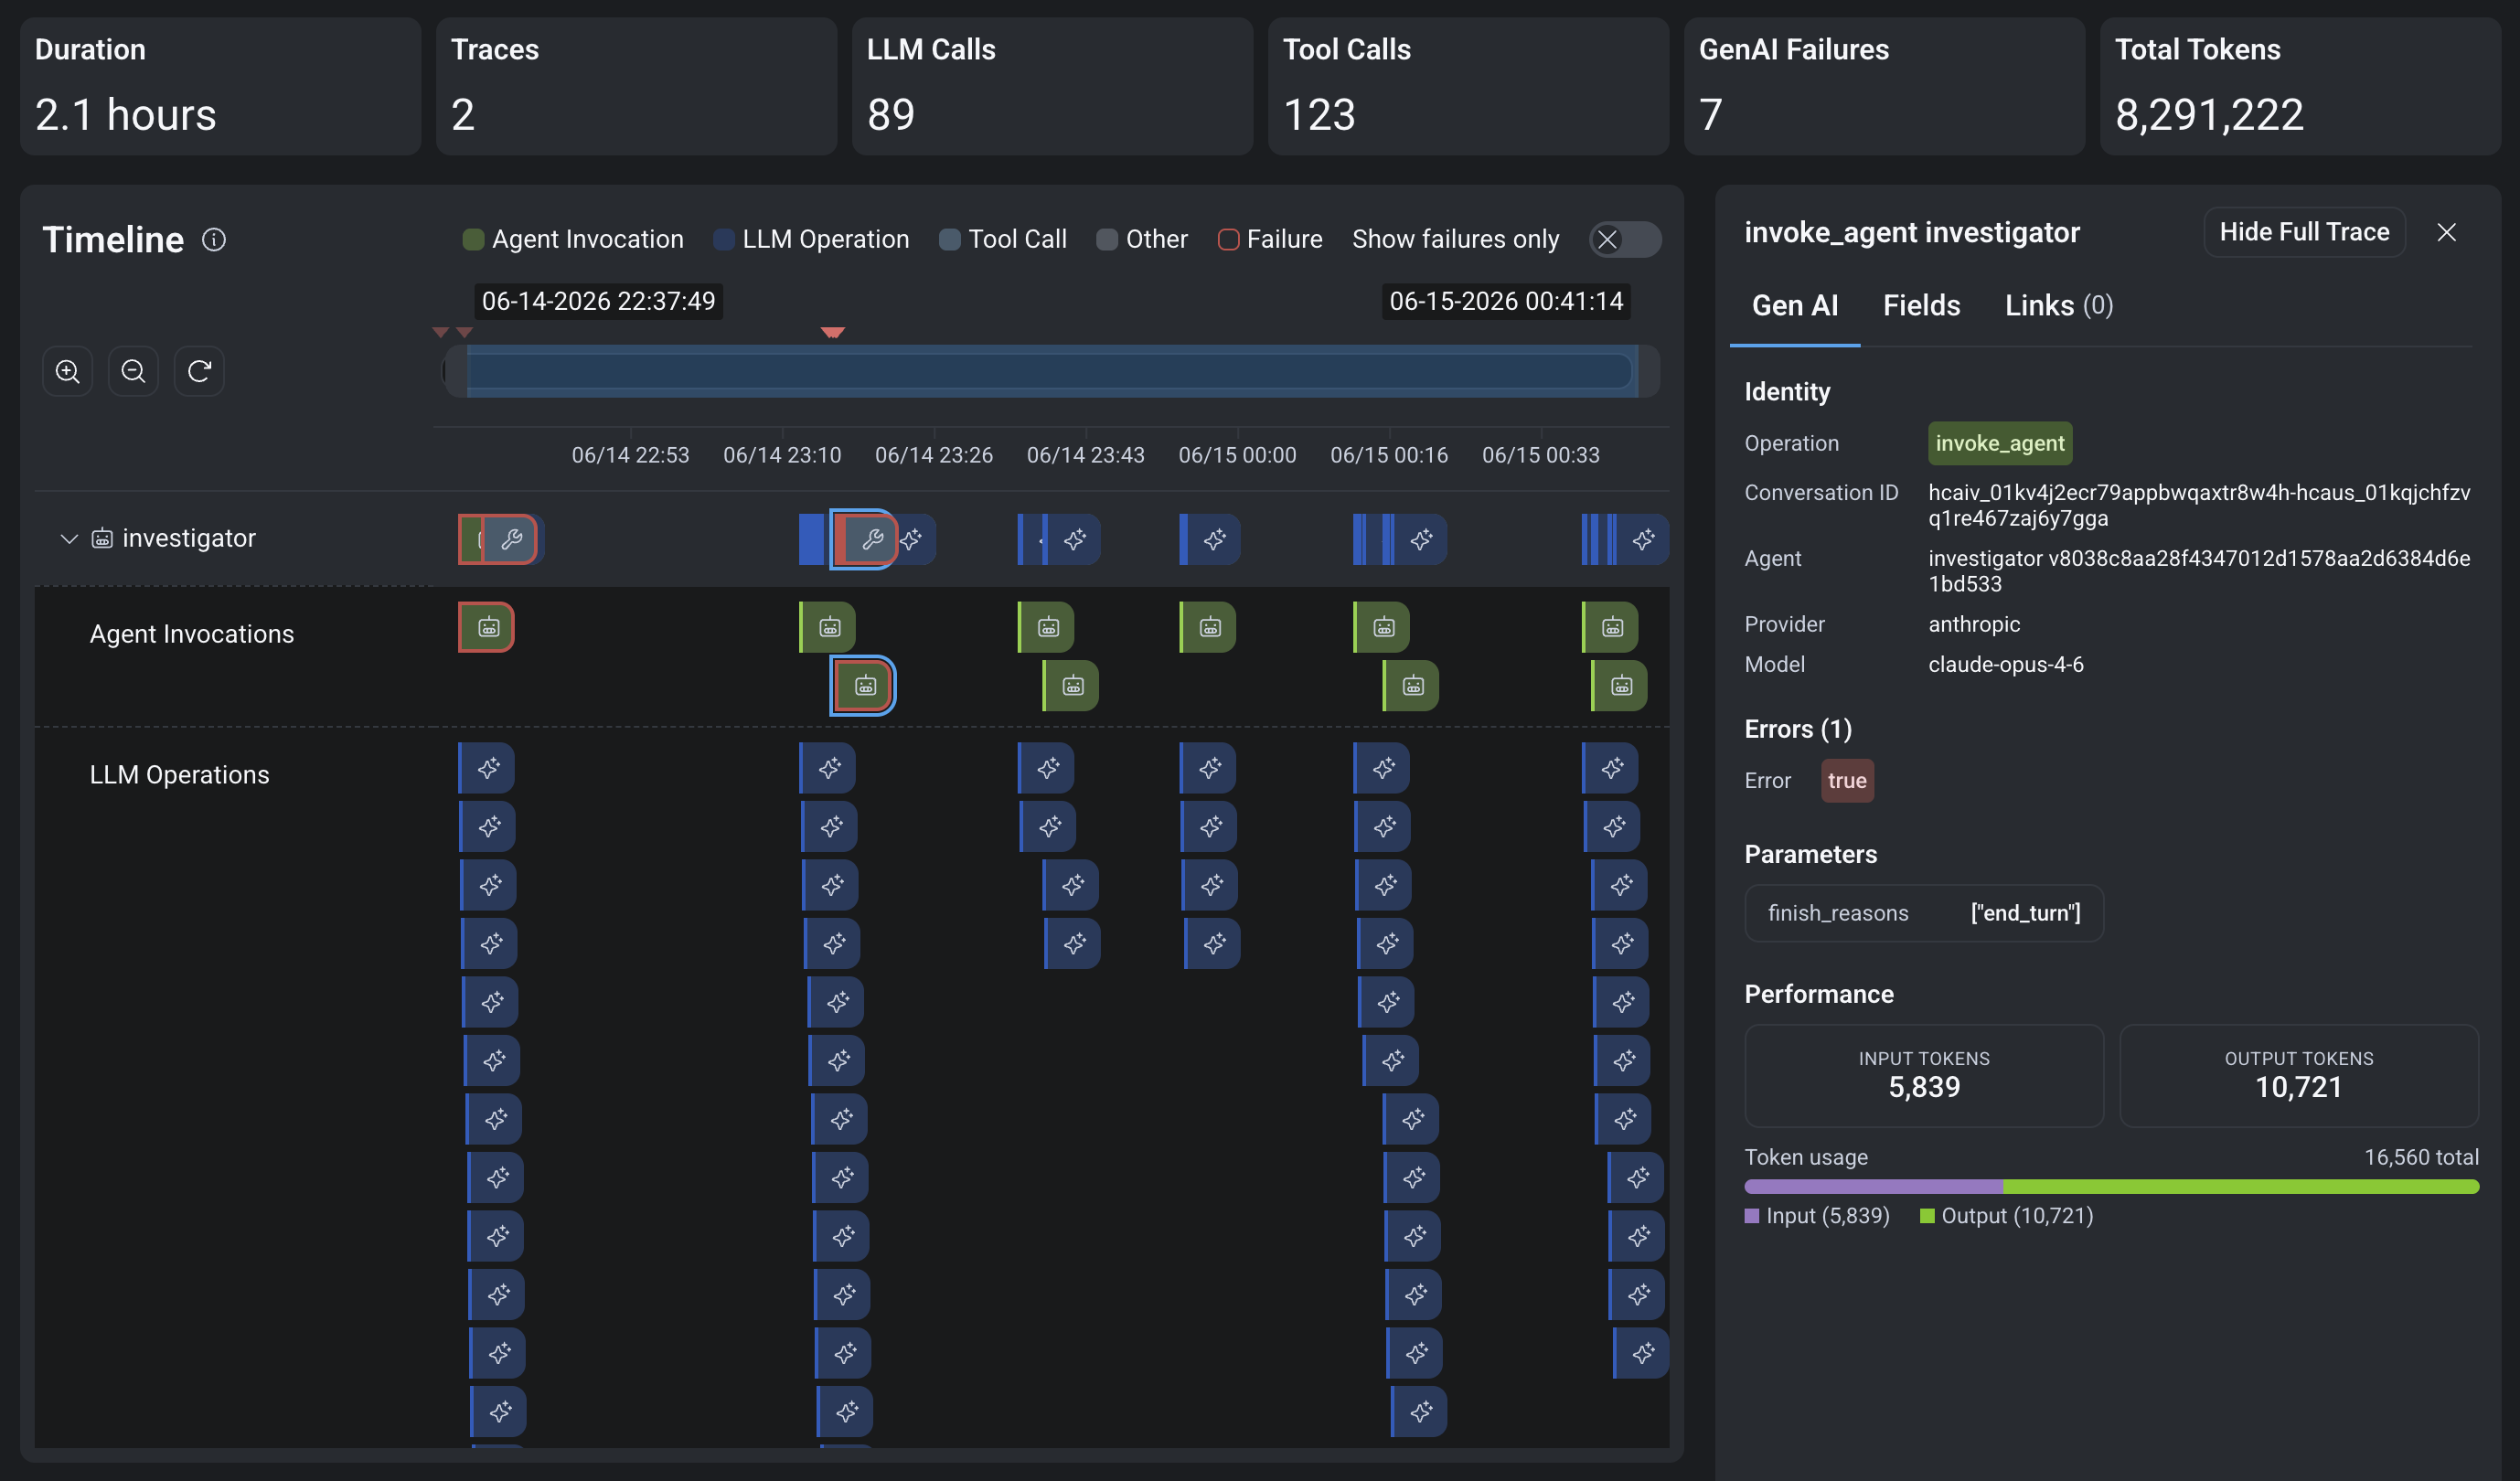
Shows the conversation view of an investigation
There are a lot of messages and tool calls over the course of nearly 2 hours.
The payoff comes after the investigation finishes. An LLM judge reads the agent’s claims against the actual tool output and scores groundedness — is every factual claim traceable to something a query actually returned? The score lands as an evaluation span right next to the investigation it judged.
Over 7 days, roughly 7,400 groundedness evals scored like this:
| Score | Share |
|---|---|
| mostly grounded | 32% |
| partially grounded | 29% |
| fully grounded | 23% |
| weakly grounded | 11% |
| ungrounded | 5% |
So about 16% land weakly grounded or worse — and the judge tags why (hallucinated data, over-extrapolation, unsupported claim). The explanations are diagnostic on their own. A representative pair, lightly anonymized:
“The agent correctly identified that test-mode payments are stuck in a pending status… However, payment amounts are off by factors of 10–100, a specific error status is asserted but doesn’t appear in any query result, and the commit hash appears to be hallucinated.”
“Every substantive claim — the error type, the HTTP codes, the transaction-flow details — is directly traceable to tool results. The diagnosis is supported not by invention but by the upstream service’s own error message and corroborating query data.”
And because the eval is just a span, “show me investigations that mention a deploy and score ungrounded” or “is groundedness sliding since the last prompt change?” are ordinary queries. You can alert on the score. You can gate a release on it. You can break it down by customer, by model, by failure mode.
Worth separating two jobs here:
- the eval executor — the judges, scorers, test cases — can live in a dedicated evaluation tool
- the backend is where the scores land as production telemetry
One runs the offline evaluation; the other tells you what actually happened in the wild. You don’t need a productized integration between them — you map the scores into events and query them next to everything else.
The line, end to end
Read left to right, here’s each station, what it drops into the backend, and what that signal lets you do:
| Station | What the AI does | Signal it emits | What the data unlocks |
|---|---|---|---|
| Create / modify | Engineer pairs with an AI assistant | hooks, chat <model>, execute_tool, cost, tokens |
Settle “did it follow the rules?”; enforce constraints in hooks |
| Handoff | Ticket → agent opens PR | invoke_agent, review.*, status/exit on span |
Audit autonomous runs; debug slow/stuck runs from the trace |
| Build / test | CI; some jobs are LLM reviews | pipeline spans + chat <model> side by side |
Ask “inference vs. compilation” as one query; unlock agent views |
| Operate | Agent investigates prod incidents | invoke_agent investigator, evaluate groundedness |
Alert/gate on eval scores; track quality by model and failure mode |
The trick underneath all of it is dull on purpose: it’s all OpenTelemetry, all gen_ai.* conventions, all queried the same way. A model name means one thing in an IDE, a CI run, and a customer-facing agent. The same query engine you’d point at a slow database query points just as well at why an agent ignored an instruction or invented a latency number.
What’s still ahead
The reason to instrument isn’t the dashboard you get on day one. It’s that once the signal’s flowing, each thing you build makes the next thing cheap:
- Seeing turns into enforcing. The IDE already made that jump — watch the behavior, then move the rule out of a document the model can ignore and into a hook it can’t.
- Scoring turns into gating. Groundedness is a span today, which means it can be an alert tomorrow and a release gate after that. The data’s already the right shape.
- Scattered turns into stitched. Right now conversation ID is the highest taxonomic level. Including the evals in the conversation or even the original trace ID would allow better aggregation and evaluation in the future.
- One place turns into everywhere. The evals only look at the production telemetry because it’s the highest fidelity signal. What would it take to get evals running on the CI and even IDE activities? Is a developer hating life because they’re trying to use Sonnet for an Opus-shaped problem?
These patterns emerged over the past few months. As things get better and more interconnected, aspects of this will probably become obsolete or redesigned entirely.
We can safely make these sorts of changes because we know what it is doing today so we will be able to compare it with the future state!